Halfway Through the Bear: What On-Chain Data Says About What Comes Next
173 days since the $126K top, every key oscillator sits at the bottom of its annual range. The cycle clock says we're 45% of the way through, and history says there's more to come.

History gives us a framework. The 2014 bear lasted 411 days top to bottom. The 2018 bear took 363 days. The 2022 bear took 378 days. The average across all three: 384 days. It has been 173 days since Bitcoin printed $126,000 on October 6, 2025. At this point, we're sitting at the 45% mark. If this cycle rhymes with history, the bottom window lands somewhere between September and November 2026, roughly 6 more months from today.
At $66,667, we're down 47.1% from that peak. The question every investor is asking: how much further?
Cycle timing alone is not enough. The real question is: does the on-chain data support the idea that we're in the middle of a bear market and not at the end of one? Let's run through the numbers.
Executive Summary
- Bitcoin sits at $66,667, down 47.1% from the $126,000 cycle top on October 6, 2025. We are 173 days into the bear market, roughly 45% of the way through the average top-to-bottom timeline of 384 days.
- 9 out of 9 key on-chain oscillators are in the bottom decile (P0-P10) of their 365-day range. MVRV at P3, NUPL at P3, Supply in Profit at P3, Puell Multiple at P0, Reserve Risk at P1. This is a bear market by every quantitative definition.
- STH are deeply underwater: STH Cost Basis is $83,694, meaning price is 20.3% below where recent buyers entered. Only 3.2% of STH supply is in profit.
- LTH haven't capitulated yet. LTH MVRV is still at 1.52 (profitable), and LTH are accumulating at +24,613 BTC/day. This is phase 1 of 2: STH pain is here, LTH capitulation is not.
- Realized Price at $54,221 remains untested, sitting 23% below current price. Every prior cycle bottom has tested or broken below Realized Price. That level is the final boss.
- Historical pattern: At 173 days into the 2014, 2018, and 2022 bear markets, Bitcoin was at a similar stage of drawdown, and in every case continued falling for another 190-240 days. The diminishing drawdowns pattern (-87%, -84%, -78%) suggests this cycle's bottom could land around -55% to -60%, or roughly $50,000 to $57,000.
1. The Composite Momentum: Everything at Annual Lows
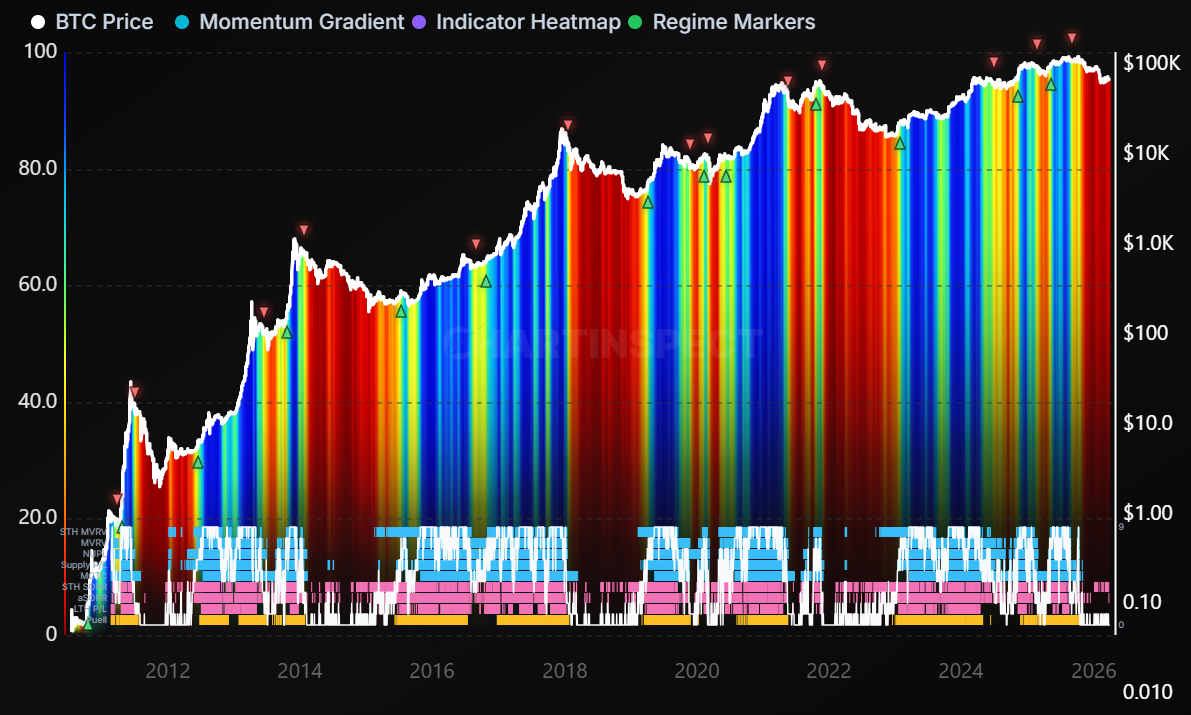
Combines multiple on-chain momentum indicators into composite metrics: Binary Consensus (% of indicators bullish) and Weighted Momentum Score.
on-chain-metrics / composite-momentum
Features adjustable weights per indicator and heatmap visualization showing individual indicator signals.
chartinspect.com
Here's the state of every major on-chain indicator right now, measured against its own 365-day range:
| Metric | Current Value | 365d Percentile | All-Time Percentile | Trend |
|---|---|---|---|---|
| MVRV Ratio | 1.2284 | P3 | P22 | Flat |
| NUPL | 0.1859 | P3 | P22 | Flat |
| Supply in Profit | 53.7% | P3 | P11 | Flat |
| SOPR | 0.9862 | P6 | P8 | Flat |
| STH MVRV | 0.7965 | P10 | P11 | Flat |
| LTH MVRV | 1.5201 | P0 | P27 | Falling |
| Puell Multiple | 0.4254 | P0 | P2 | Rising |
| Reserve Risk | 0.0012 | P1 | P7 | Flat |
| AVIV Z-Score | -0.3471 | P3 | P11 | Flat |
Average 365d percentile across all 9: P3.
Every single oscillator is in the bottom 10% of its annual range. This is not a mixed signal environment. This is not "some metrics say X, others say Y." The data is unanimous: we are in a deep value zone on a 1-year basis.
However, on an all-time basis, most of these metrics are in the lower to middle area of their 1 year range, not at extreme cycle-bottom territory. MVRV at P22 all-time means we've been lower in 22% of Bitcoin's history. At the 2018 and 2022 bottoms, MVRV was at P5-P7 all-time.
The annual percentiles are mostly saying, "bottom of the recent range." The all-time percentiles say "getting there, but not yet."
2. The Price Level Map: Three Zones of Truth
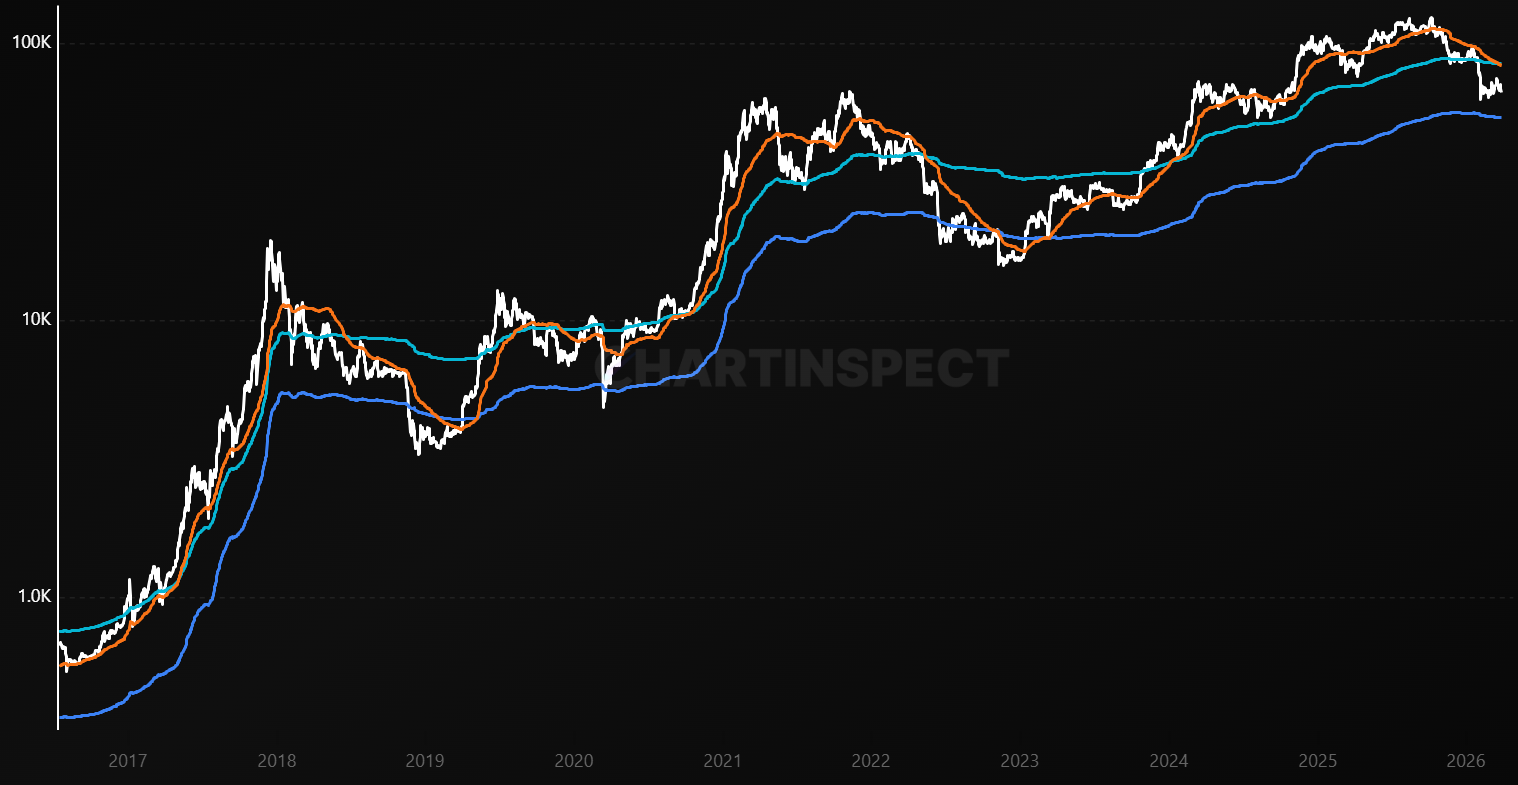
Display Bitcoin price alongside fundamental onchain price levels including Realized Price, Investor Price, Cointime Price, True Market Mean, and Vaulted Price.
on-chain-metrics / onchain-price-levels
Compare current market price to various onchain-derived fair value estimates.
chartinspect.com
On-chain price levels paint a clear picture of the battlefield. Right now, Bitcoin is trapped in a well-defined zone:
Zone 1: Overhead Resistance (broken below)
| Level | Price | Distance |
|---|---|---|
| Active Realized Price | $85,028 | -21.6% below |
| STH Cost Basis | $83,694 | -20.3% below |
| True Market Mean | $78,160 | -14.7% below |
These are the levels Bitcoin needs to reclaim to argue that the bear is over. The True Market Mean at $78,160 is especially important: it separates bullish from bearish regime on the AVIV framework. We're 14.7% below it and falling. The Active Realized Price and STH Cost Basis act as a ceiling. Any relief rally into the $78-85K range will meet intense selling pressure from underwater short-term holders who want to exit at breakeven.
Zone 2: Current Range (where we are)
Bitcoin at $66,667 is floating in no-man's land between the broken overhead levels and the deep support below. There's no strong on-chain support cluster in the $60-75K range.
Zone 3: Deep Support (targets below)
| Level | Price | Distance |
|---|---|---|
| Realized Price | $54,221 | +23.0% above |
| Investor Price | $49,797 | +33.9% above |
| CVDD | $48,117 | +38.6% above |
| LTH Cost Basis | $43,856 | +52.0% above |
The Realized Price at $54,221 is the "final boss." Every single cycle bottom in Bitcoin's history has tested or broken below Realized Price. When MVRV drops below 1.0, it means the average holder is underwater, and that's when real capitulation occurs. We're at MVRV 1.23 now, still 23% above that level.
3. The Two-Phase Capitulation: STH Are Done, LTH Are Not
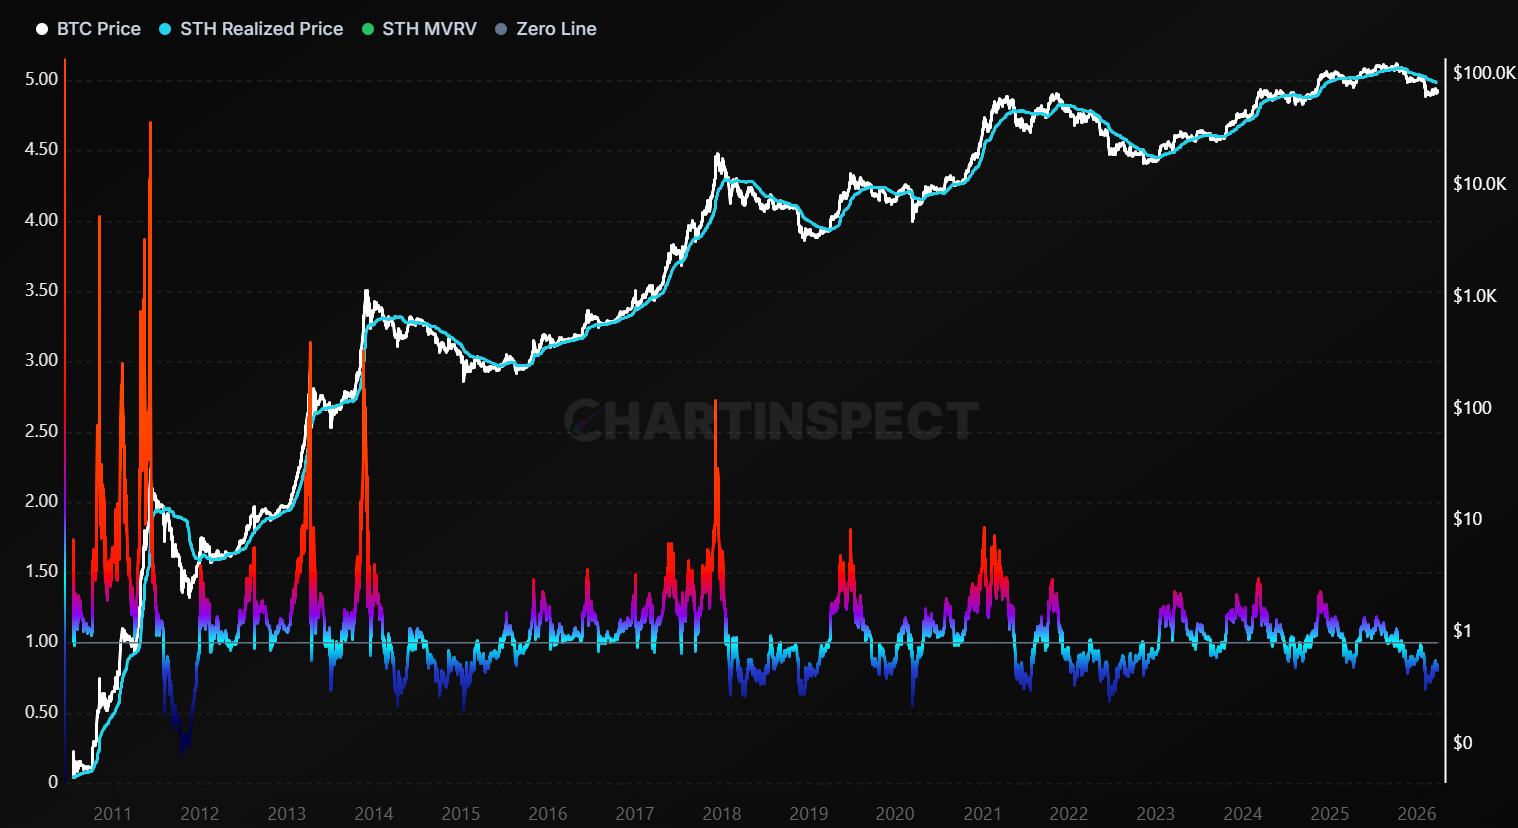
Monitor Short-Term Holder MVRV, the market-value-to-realized-value ratio for coins held under 155 days,
on-chain-metrics / sth-mvrv
showing new buyer profit or loss as a direct multiple with color-graded zones.
chartinspect.com
This is the most important distinction in the current market structure. Bear markets don't end with one round of capitulation. They end with two.
Phase 1 (underway): Short-Term Holder Capitulation
The numbers are brutal for STH:
- STH MVRV at 0.7965, meaning the average short-term holder is sitting on a 20% unrealized loss
- Only 3.2% of STH supply is in profit. 23% of all circulating supply held by STH is underwater.
- STH SOPR at 0.9937, meaning STH who are selling are locking in losses
- STH Cost Basis at $83,694 acts as a gravity well: any bounce toward it triggers selling from holders desperate to exit at breakeven
This is textbook Phase 1 capitulation. The tourists, the late-cycle buyers, the leveraged speculators, they're in pain and selling. This creates persistent downward pressure even as long-term fundamentals improve.
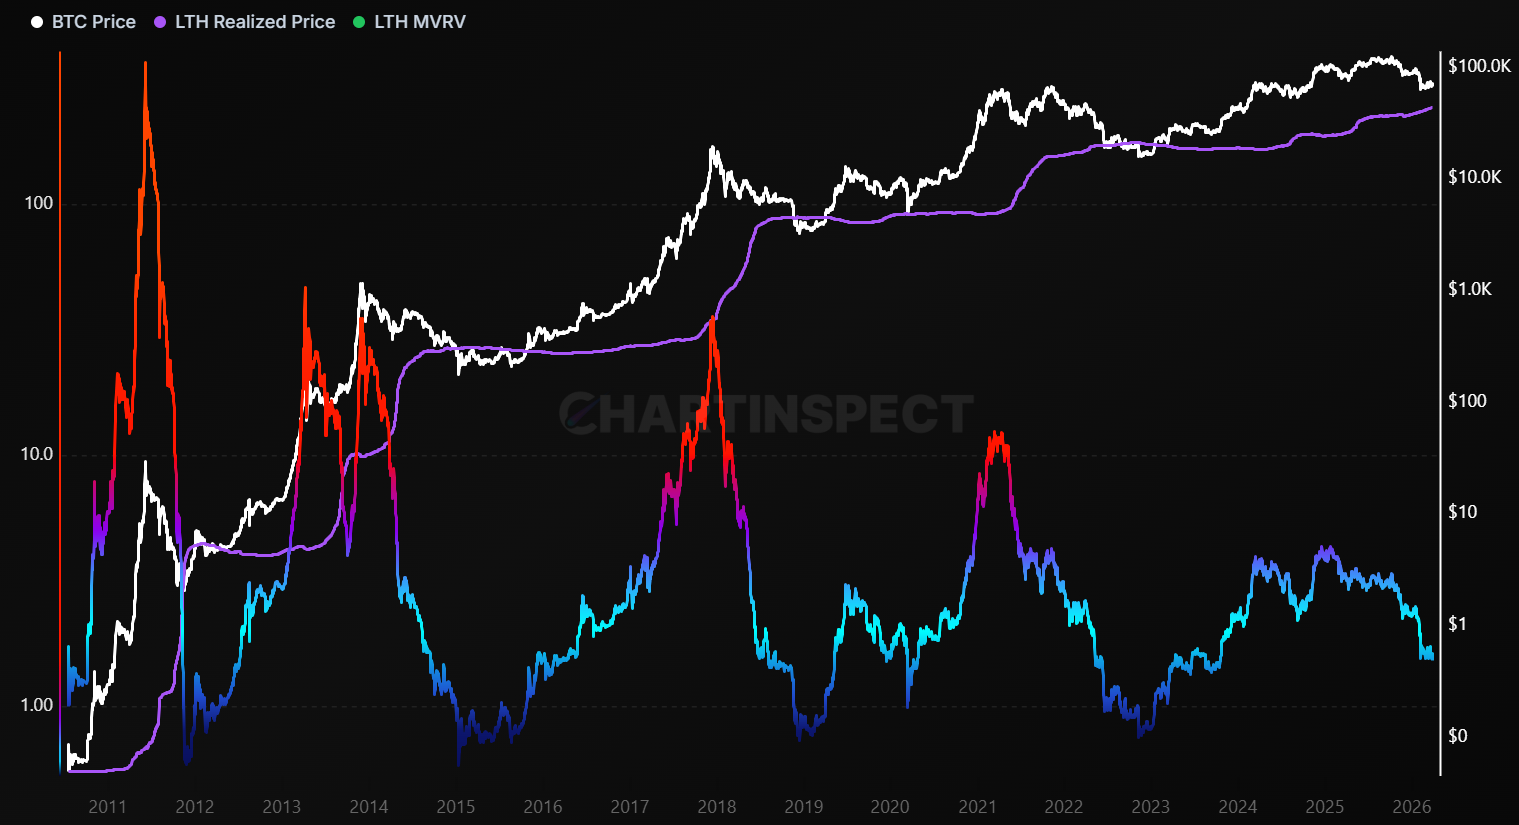
Track Long-Term Holder MVRV - long-term holder market value vs realized
on-chain-metrics / lth-mvrv
value ratio showing direct profit/loss multiples with intuitive color gradients
chartinspect.com
Phase 2 (not yet started): Long-Term Holder Capitulation
Here's where it gets interesting:
- LTH MVRV is still at 1.5201. LTH are still in profit, collectively.
- LTH are accumulating, not distributing: +24,613 BTC/day net position change (P91 on the year)
- LTH wealth concentration at 59.6% of realized cap, near all-time highs
- LTH Cost Basis is $43,856, well below current price
At the 2018 bottom, LTH MVRV was 0.73. At the 2022 bottom, it was 0.76. Today it's 1.52. LTH haven't been squeezed yet.
What triggers Phase 2? Price needs to drop into the $55-65K range, where a cohort of LTH who accumulated during the 2024-2025 bull market starts going underwater. When that happens, LTH begin selling at a loss, Realized Cap starts declining, and the classic bottom signals (MVRV < 1, NUPL negative, Supply in Profit below 50%) finally flash.
We're in the uncomfortable middle: STH pain is real and ongoing, but the LTH capitulation that historically marks cycle bottoms hasn't begun.
4. Historical Comparison: Where We Sit vs. Prior Bear Markets
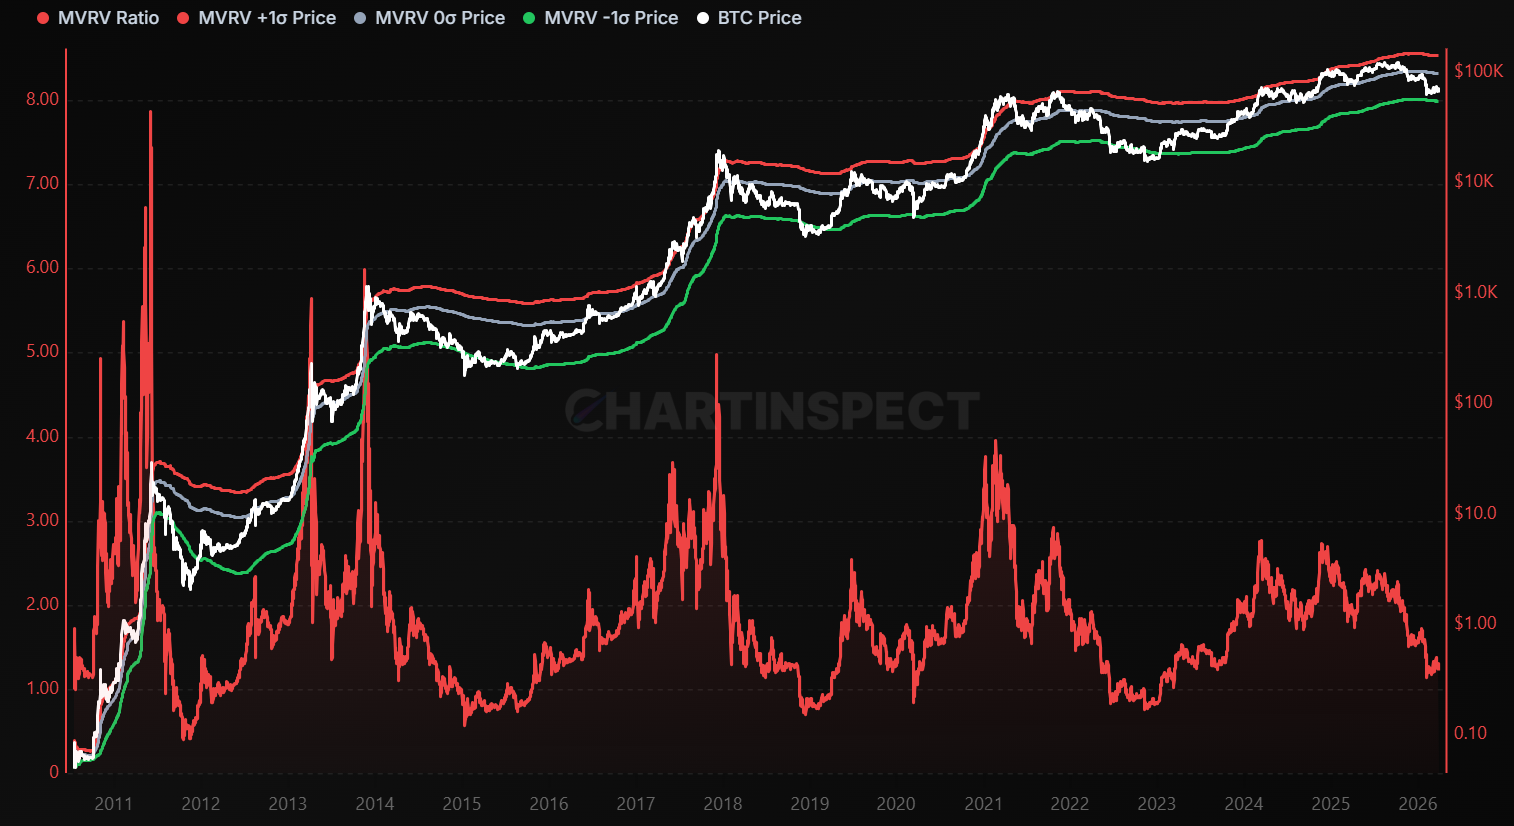
Monitor Bitcoin Market Value to Realized Value (MVRV) ratio alongside realized price and
on-chain-metrics / mvrv
bitcoin price. Statistical bands reveal historical overvaluation and undervaluation zones for market timing
chartinspect.com
Let's compare the current readings to the exact values recorded at the December 2018 and November 2022 cycle bottoms:
| Metric | 2018 Bottom | 2022 Bottom | Current | Gap to Bottom |
|---|---|---|---|---|
| MVRV | 0.71 | 0.78 | 1.23 | Still 58-73% above bottom levels |
| NUPL | -0.42 | -0.29 | +0.19 | Still positive (bottoms are negative) |
| STH MVRV | 0.64 | 0.82 | 0.80 | Between prior bottom levels |
| LTH MVRV | 0.73 | 0.76 | 1.52 | 2x above bottom levels |
| Supply in Profit | 41.0% | 44.5% | 53.7% | 9-13 percentage points above |
| SOPR | 0.972 | 0.974 | 0.986 | Approaching (within 1.2%) |
| Puell Multiple | 0.35 | 0.45 | 0.43 | Between prior bottom levels |
| Reserve Risk | 0.0017 | 0.0008 | 0.0012 | Between prior bottom levels |
The pattern is clear: STH metrics are already at or between cycle-bottom levels, but LTH metrics and broad market metrics (MVRV, NUPL, Supply in Profit) are still well above prior bottom readings.
Three metrics are already between their 2018/2022 bottom values: STH MVRV, Puell Multiple, and Reserve Risk. These tend to be early signals. The lagging indicators, the ones that confirm the actual bottom (MVRV < 1, negative NUPL, Supply in Profit below 45%), have room to fall.
5. The Cycle Clock: Timing the Trajectory
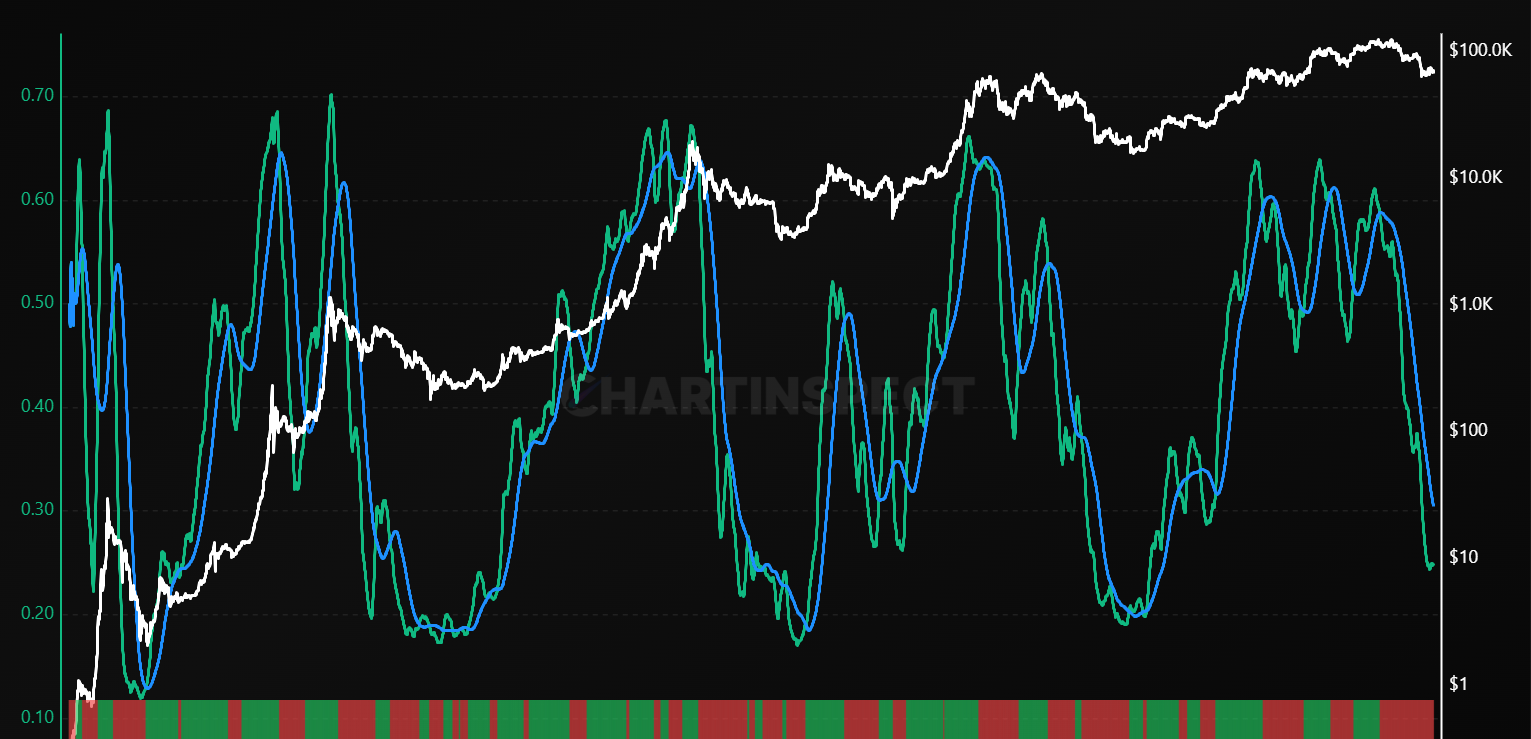
Advanced multi-dimensional on-chain cycle indicator that combines valuation stress, profit distribution, network activity, and market maturity with adaptive weighting.
on-chain-metrics / bitcoin-cycle-index
Identifies Bitcoin market cycle tops and bottoms with high precision.
chartinspect.com
Here's how the drawdown trajectory compares at the same point in each cycle (173 days after the top):
| Cycle | Drawdown at Day 173 | Final Drawdown | Remaining Drop |
|---|---|---|---|
| 2014 | -50% | -87% | -37 more pp |
| 2018 | -69% | -84% | -15 more pp |
| 2022 | -44% | -78% | -34 more pp |
| 2026 | -47% | ? | ? |
In every prior cycle, Bitcoin had significant downside remaining at the 173-day mark. The 2014 cycle nearly doubled its drawdown from this point. The 2022 cycle added another 34 percentage points of decline.
The diminishing drawdown pattern across cycles has been remarkably consistent:
| Cycle | Max Drawdown |
|---|---|
| 2011 | -93% |
| 2014 | -87% |
| 2018 | -84% |
| 2022 | -78% |
| 2026 (projected) | -55% to -60%? |
If we follow the ~5-6 percentage point compression per cycle, the 2026 bottom would be roughly -55% to -60%, which translates to $50,400 to $56,700. That range aligns almost perfectly with the Realized Price at $54,221.
My base case: Bitcoin grinds lower over the next 5-6 months, tests Realized Price in the $54-56K zone, LTH capitulation triggers somewhere in the $55-65K range, and the bottom forms around Q4 2026. The -47% drawdown we've seen so far is real pain, but it's not the final flush.
6. What Would Change This View?
I'm not married to a thesis when the data contradicts it. Here are the specific conditions that would make me reconsider:
Bull case trigger (re-evaluate bear thesis):
- Reclaim and hold True Market Mean ($78,160) for 2+ weeks
- STH MVRV back above 1.0 with rising momentum
- MVRV Z-Score turns positive with a sustained uptrend
- Supply in Profit back above 70% with improving breadth
Bear case accelerator (worse than expected):
- Realized Cap continues declining (currently at $1.1T, mild decline)
- LTH SOPR sustained below 0.5 (currently 0.71, already low)
- Supply in Profit drops below 45% without a bounce
- Loss of Realized Price ($54,221) on high volume
One of the most important metrics to watch right now: LTH MVRV. It's falling at ~7% per month. When it crosses below 1.0, that is the signal that LTH are collectively underwater and Phase 2 capitulation has begun. At the current rate of decline, that crossover could come 3-5 months from now, which lines up perfectly with the cycle clock.
Summary
| Factor | Status | Assessment |
|---|---|---|
| Cycle timing (days since top) | 173 of ~384 days | 45% complete, on schedule |
| Price drawdown | -47.1% | Consistent with mid-bear (prior cycles: -44% to -69% at this point) |
| Oscillator regime | P3 average (365d) | Deep value zone on annual basis |
| STH capitulation | STH MVRV 0.80, 3.2% in profit | Phase 1 complete: STH are crushed |
| LTH capitulation | LTH MVRV 1.52, still accumulating | Phase 2 not started: the main event is ahead |
| Realized Price test | $54,221 (23% below price) | Not tested yet; every cycle bottom tests it |
| Bottom conditions (MVRV < 1, NUPL < 0) | MVRV 1.23, NUPL +0.19 | Not met; readings still well above cycle bottoms |
| Diminishing drawdown target | -55% to -60% ($50-57K) | Aligns with Realized Price and Investor Price zone |
The cycle clock says we're on schedule. The on-chain data confirms we're in a bear market, and has since December. But the readings that define cycle bottoms (MVRV below 1, negative NUPL, LTH underwater) haven't arrived yet. History says they will. The timing suggests Q4 2026.
We're in the boring, painful middle of the bear market. Not the panic of the initial drop, not the capitulation of the final flush. Rather, we are in the slow grind that tests conviction for many holders. This is where the cycle bottom gets built, one day at a time.
All charts referenced in this article are available on ChartInspect. The Composite Momentum dashboard, MVRV, STH/LTH MVRV, and On-Chain Price Levels are available to all users. Accumulation Index, AVIV framework, LTH Unrealized Profit Ratio, and Realized P/L metrics require a PRO subscription.
Join the Telegram community for real-time updates.
Subscribe to ChartInspect Research to get this newsletter every week.
Not financial advice. Always do your own research.
Enjoyed this article?
Subscribe to get the latest research in your inbox.
Comments
Sign in to join the discussion.