How Close Are We to a Bitcoin Cycle Bottom?
Using 5 on-chain metrics to build a cycle bottom checklist — and none of them are fully met yet.

Bitcoin is down 48% from its all-time high and sentiment has reached historic extremes. The Fear & Greed Index printed 5 earlier this week, the lowest reading ever recorded, below the COVID crash, below FTX, below the 2018 capitulation low.
The natural question in an environment like this is whether the bottom is in. It's the wrong question, or at least an incomplete one. A more useful framing is: how many of the conditions that have historically preceded every cycle bottom are currently present?
What follows is a framework built around five on-chain metrics, each evaluated against its historical behavior at confirmed cycle lows. The goal is not to call a bottom, but to build a checklist, and to be honest about how many boxes we can check today.
Long-Term Holder Capitulation: Early Stages
The LTH Realized P/L Ratio shows the ratio between long-term holder realized profit and loss.
on-chain-metrics / lth-realized-pl-ratio
Provides insight into macro trends, market sentiment shifts, and directional dominance of value flows. Includes LTH-SOPR comparison for per-output analysis.
chartinspect.com
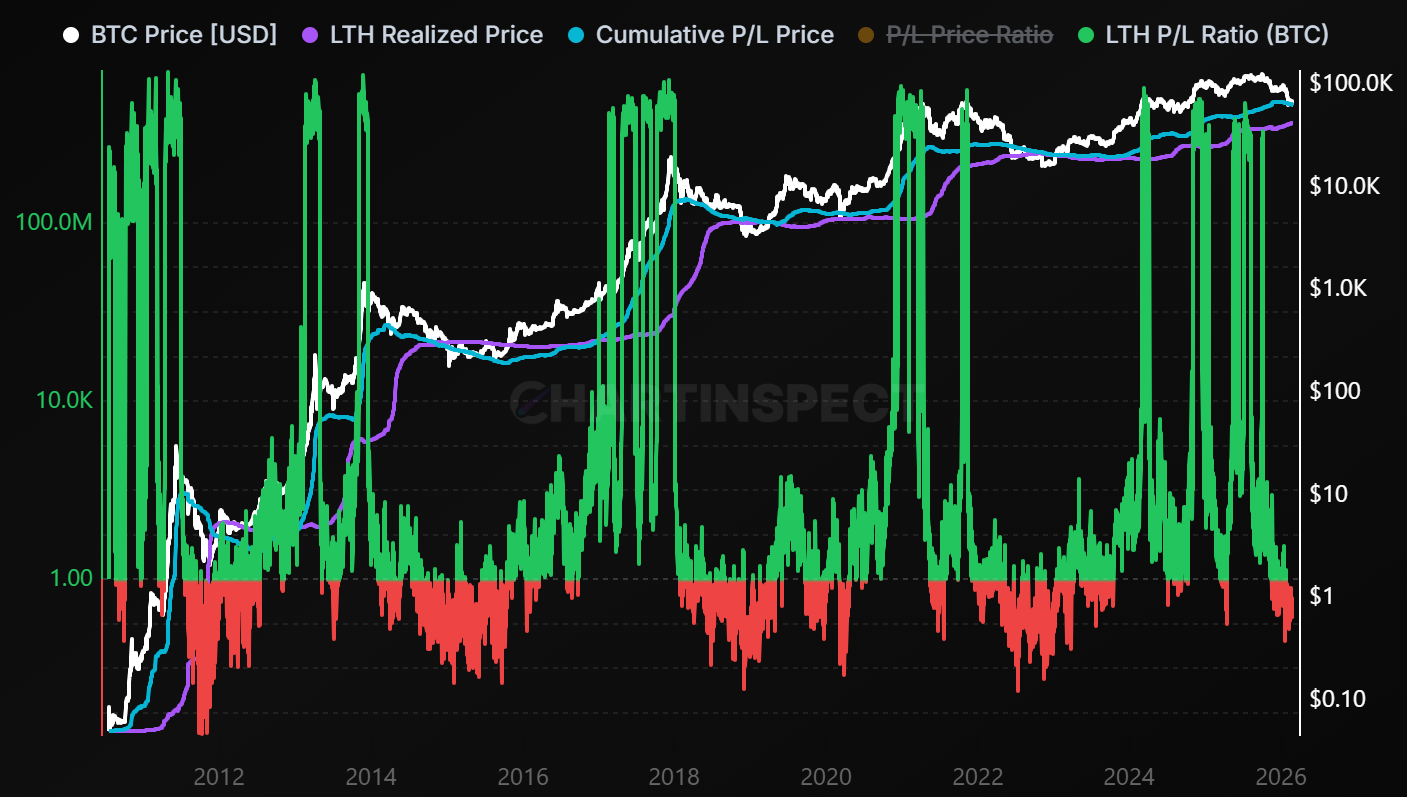
The LTH Realized P/L Ratio captures the aggregate profit-taking versus loss-realization behavior of Bitcoin's most patient cohort: holders who have maintained their positions for 155 days or more. When this ratio sits above 1.0, long-term holders are collectively moving coins at a profit. When it falls below 1.0, losses dominate. This is the textbook definition of conviction-holder capitulation.
The current raw reading (BTC denomination, no smoothing) sits at 0.118. For every 1 BTC of realized profit among long-term holders, approximately 8-9 BTC of realized losses are being recorded. On the 7-day EMA, which filters out daily noise and provides a cleaner structural view, the ratio is at 0.215.
Both readings confirm that long-term holder capitulation is underway. However, context from prior cycles is important here. At the 2022 cycle bottom, the 7-day EMA dropped below 0.10 and remained there for a sustained period, weeks not days. The 2018-2019 bottom exhibited the same pattern. At 0.215, the current smoothed reading tells us we're in the early-to-mid stages of this process, not the peak of capitulation.
There is a secondary convergence signal embedded in this chart that deserves attention. The LTH Realized Price (purple, ~$41,900) and the Cumulative P/L Price (cyan, ~$63,200) have historically pinched together at cycle bottoms. Their convergence marks the point where aggregate long-term holder cost basis and the cumulative profit/loss equilibrium price reach alignment. In 2022, convergence occurred around $16,000 near the cycle low. In 2018, around $3,900-$4,100. Today, the gap remains roughly $21,000. The narrowing process has begun, but convergence itself is still ahead of us. This does not mean Bitcoin has to drop $21,000. These cost basis can move up over the length of the bear market. For example, the LTH Realized price may be at $50,000 in 8 months time, as long term holders resupply coins, bringing up their overall cost basis.
Assessment: Capitulation is in progress. The ratio has not reached the extreme sub-0.10 zone on the smoothed view, and the LTH Realized / Cumulative P/L convergence has not occurred. Both suggest the bottoming process has further to run.
Supply Profitability: A One-Day Convergence
Track the percentage of Bitcoin supply currently in profit or loss. A key on-chain indicator that measures market
on-chain-metrics / profit-loss
sentiment, identifies cycle tops and bottoms, and signals potential trend reversals based on unrealized gains across the network
chartinspect.com
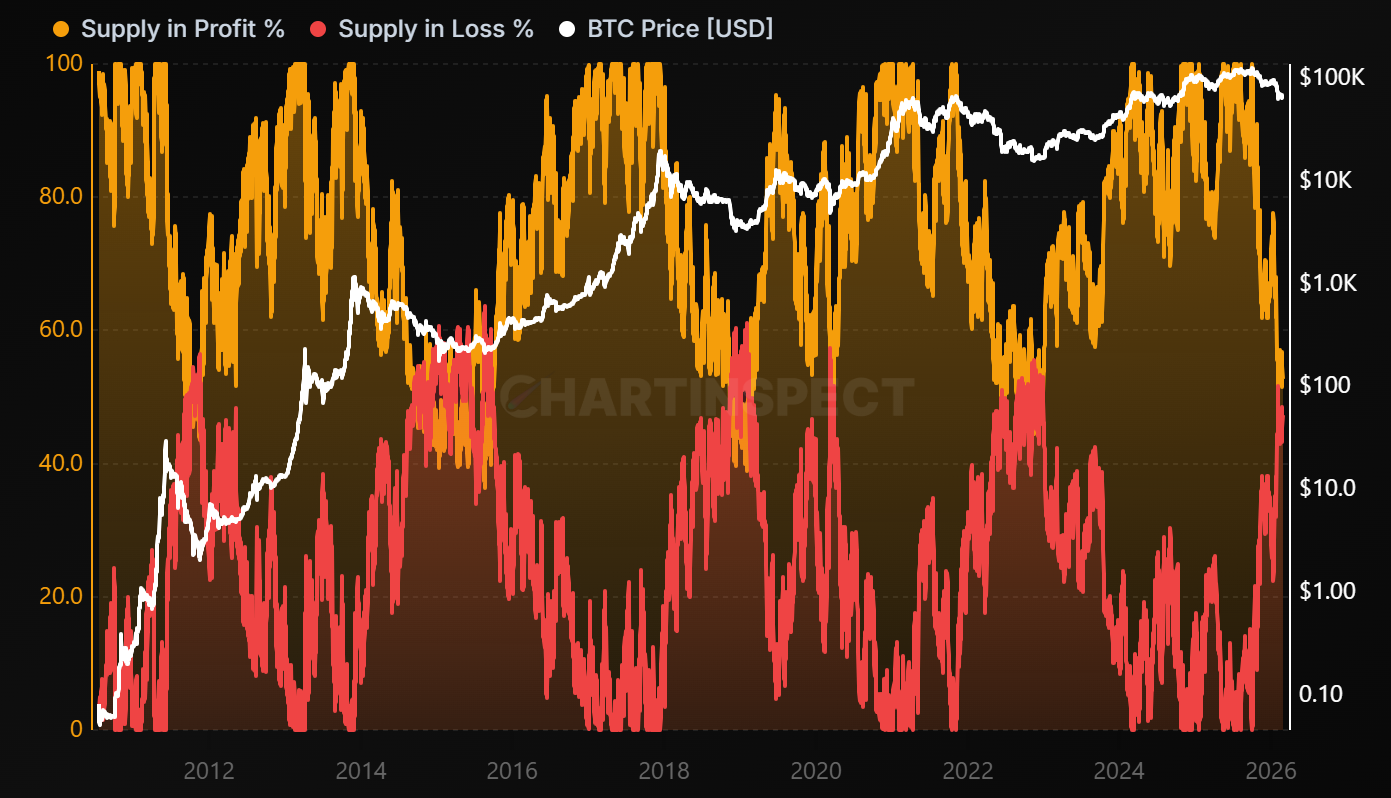
The Supply in Profit and Supply in Loss metric provides a direct measure of network-wide pain. As of this week, 53.1% of Bitcoin's circulating supply is held at a profit and 46.9% at a loss, approximately 10.61 million BTC versus 9.39 million BTC.
When Bitcoin traded above $120,000 just months ago, supply in profit sat above 95%. The decline from near-total profitability to barely above 50% reflects the severity of the drawdown and the volume of supply that was acquired at elevated price levels during the 2024-2025 rally.
The convergence area, where these two bands approach 50/50, is one of the most significant signals in on-chain analysis. At every prior cycle bottom (2015, 2018-2019, 2022), the market spent extended time at or near this equilibrium. When roughly half the network is underwater, marginal sellers have largely been flushed out.
When Bitcoin tested $60,000 on February 6th, these bands briefly converged for about one day before price bounced. On the 10-minute timeframe available to PRO users, the convergence was visible in granular detail.
However, at prior cycle bottoms, this convergence persisted for one to two months on average. One day of parity does not satisfy the structural condition in my eyes. If Bitcoin retests $60,000 or presses toward the realized price near $55,000, we should expect a more sustained period at or below 50/50, and it is that duration, not the initial touch, that historically distinguishes a short-term bounce from a true cycle low.
Assessment: The convergence zone has been touched but not held. Duration at parity remains well below historical precedent, suggesting a retest of lower levels is probable before this condition is fully satisfied.
On-Chain Valuation: Depressed but Not Extreme
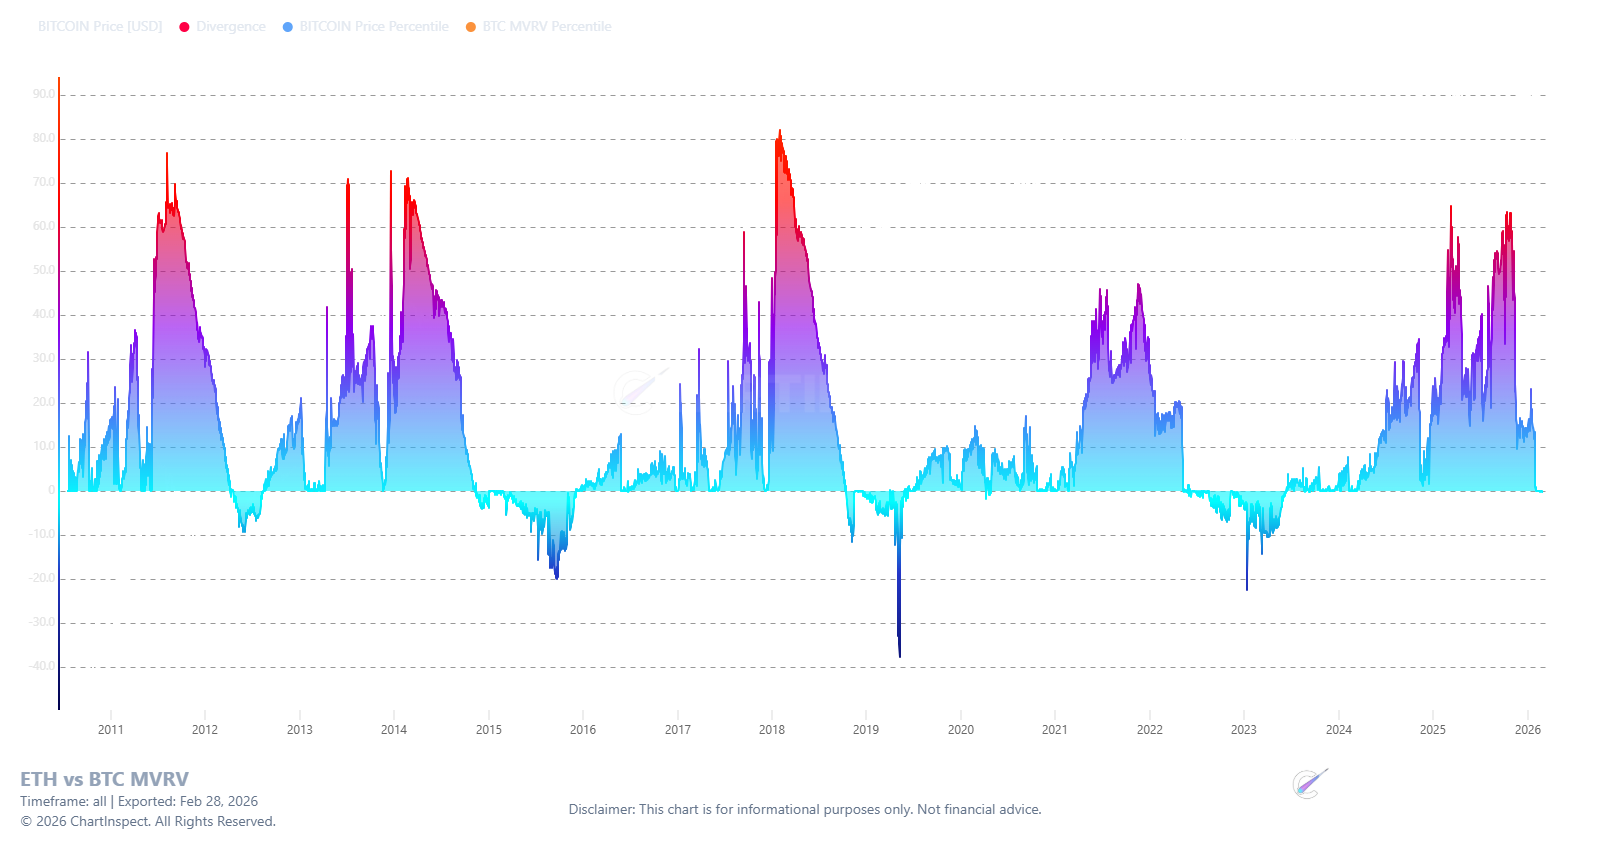
The Price vs. MVRV Percentile Divergence metric offers a cross-referenced valuation framework. It takes Bitcoin's price and the MVRV ratio, which compares market value to realized value, and measures where each sits within its trailing 365-day distribution. The divergence between these two percentile readings reveals whether price is running ahead of or behind on-chain fundamentals.
When both percentiles are elevated and price leads (positive divergence, red), the market is overheated. When both are depressed and aligned (near-zero divergence, blue), the market is in a low-valuation regime. When price drops below where fundamentals suggest (deeply negative divergence), the market is in fire-sale territory, and historically, those are the conditions that immediately precede the sharpest reversals.
Current readings:
- Bitcoin Percentile: 0.8
- MVRV Percentile: 0.8
- Divergence: 0.0
Both metrics sit at the absolute floor of their one-year range, and they agree. There is no divergence. Bitcoin's price is low, and its on-chain valuation confirms it. The chart is firmly in the blue undervaluation zone.
But the 1-year rolling window tells an incomplete story at this stage. At prior cycle bottoms, the divergence pushed meaningfully negative: approximately -31 in 2018, -22 in 2022, and -20 in 2015. Today's lowest reading has been -0.3. On this timeframe, we have not entered the territory that historically signals maximum dislocation between price and fundamentals.
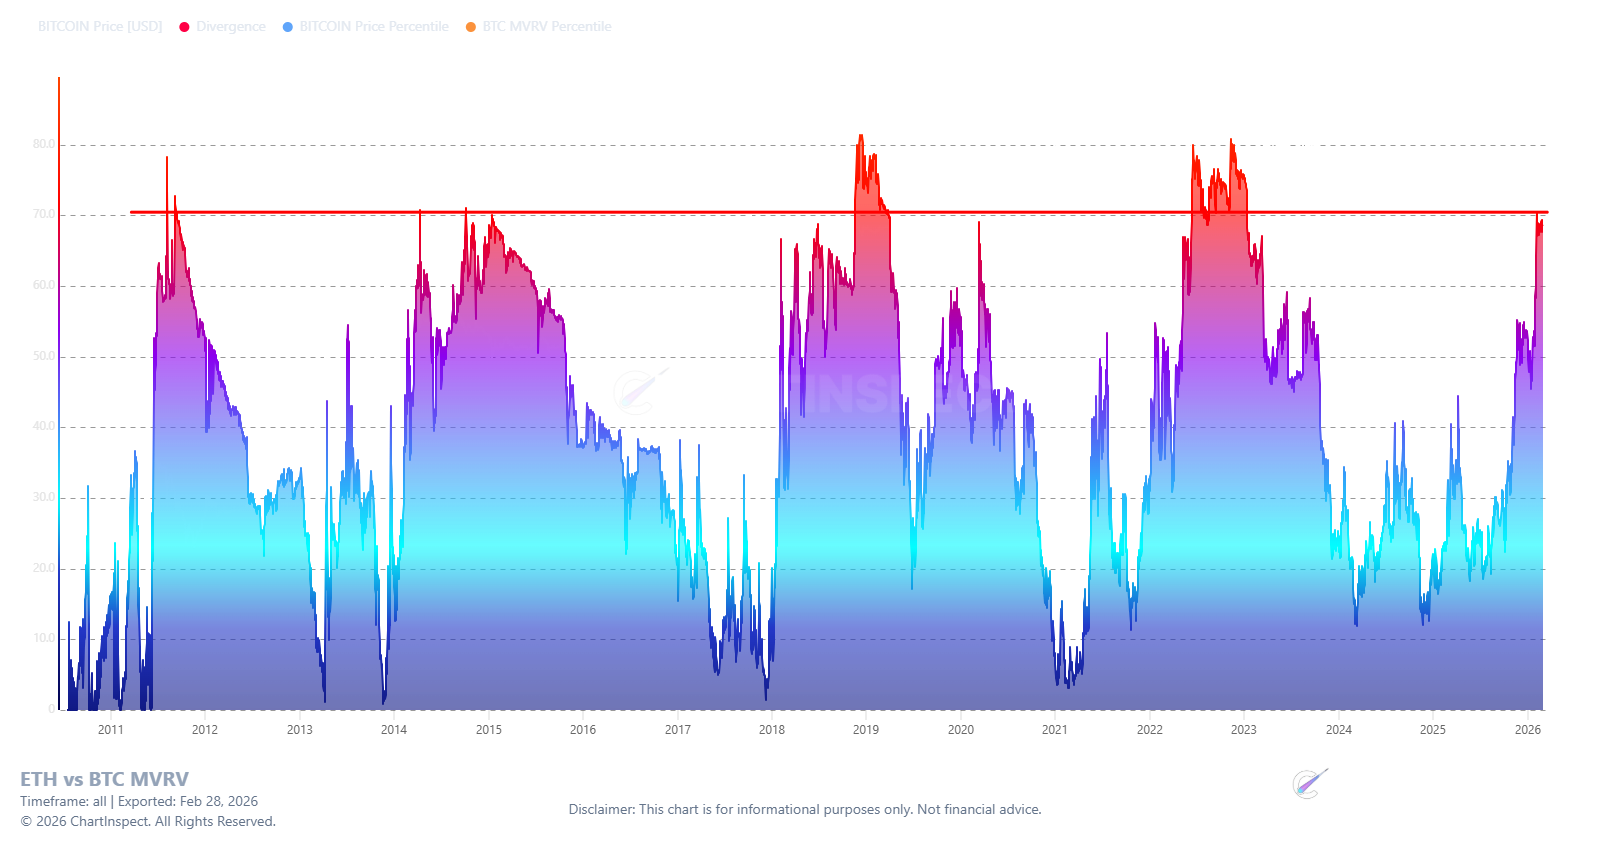
The all-time rolling window provides a more constructive reading. On this broader view, the divergence has reached +70, which falls within the range of prior cycle bottom readings (+70 to +81 in 2018 and 2022). The divergence between these two timeframes is itself informative: we are undervalued relative to Bitcoin's full history, but within the context of the last year, the drawdown has not yet produced the kind of extreme dislocations that precede the sharpest mean-reversion events.
Assessment: Firmly undervalued on the all-time window. The 1-year view has not reached the deeply negative readings associated with prior cycle bottoms, leaving room for further compression if selling continues.
Cost Basis Convergence: The Missing Signal
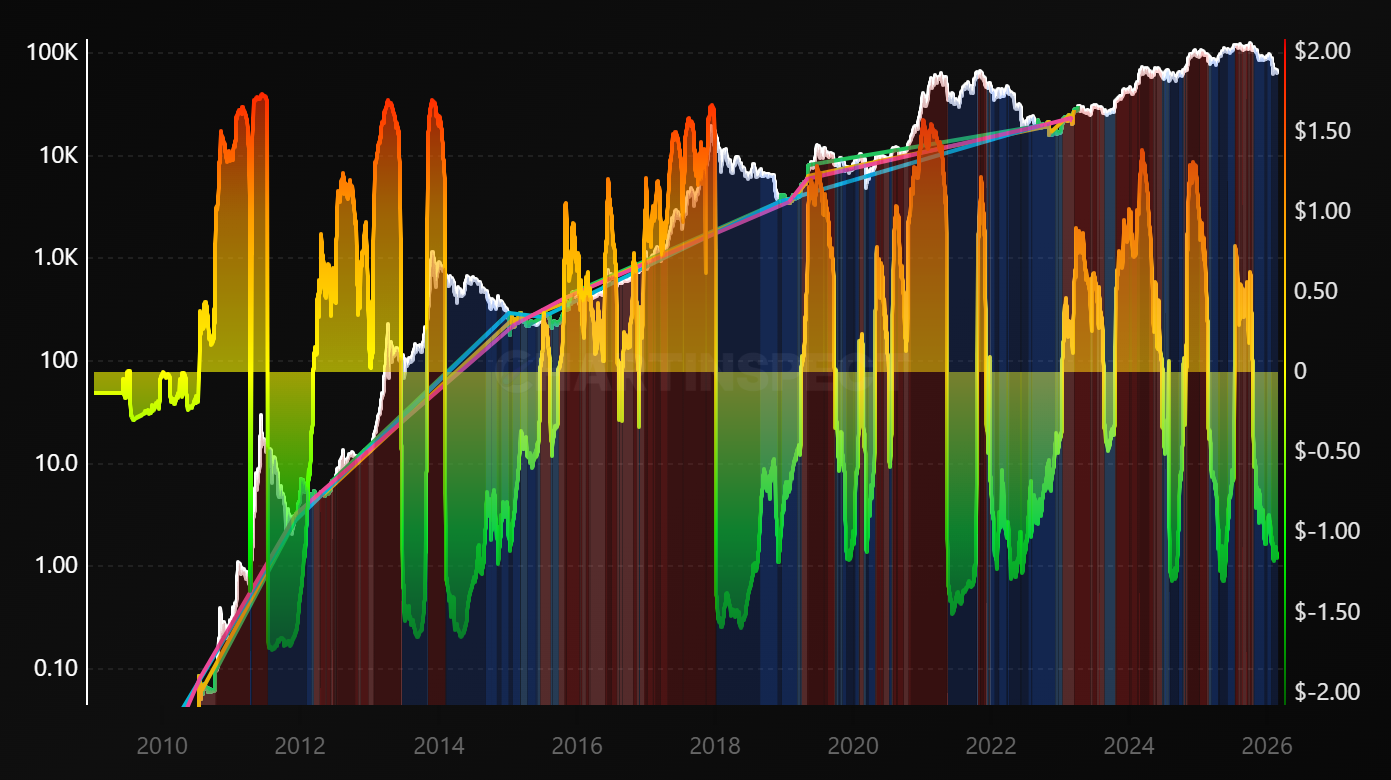
Tracks when STH Cost Basis, LTH Cost Basis, and Market Realized Price converge within 5-10%, historically marking generational market bottoms.
on-chain-metrics / cost-basis-convergence
When all holder cohorts align at similar cost basis, it indicates extreme market equilibrium and exceptional accumulation opportunities.
chartinspect.com
Cost Basis Convergence is one of the most structurally clean bottom-identification frameworks available in on-chain analysis. It tracks three metrics: the Short-Term Holder Cost Basis, Long-Term Holder Cost Basis, and Market Realized Price, and measures their alignment. When all three converge within 5-10% of each other, the market has reached a state of equilibrium: nearly all participants are near break-even, selling pressure is mechanically exhausted, and the conditions for a cycle low are in place.
The dynamics that drive convergence are intuitive. During bull markets, the STH cost basis sits far above the LTH cost basis. New entrants are paying premium prices while long-term holders enjoy substantial unrealized gains. As the bear market progresses, this spread compresses from both sides: the STH cost basis declines as new buyers enter at lower prices, while the LTH cost basis gradually rises as the cohort refreshes with coins acquired at higher levels. When the spread approaches zero, or crosses over, it signals that the market's cost basis structure has fully reset.
Current readings:
- STH/LTH Spread: +109.8%
- Spread Velocity: -1.15σ (Percentile Z-Score)
- Market Phase: Strong Accumulation
- Status: Diverged
The STH cost basis remains more than double the LTH cost basis. At prior cycle bottoms, this spread compressed to near-zero or crossed negative. We are nowhere close to that condition today.
However, the trajectory is constructive. Spread Velocity at -1.15σ confirms the spread is narrowing at an above-average rate. The chart's market phase classification reads "Strong Accumulation," driven by the negative velocity. When the STH cost basis declines faster than the LTH cost basis rises, it indicates that new positioning is increasingly occurring at lower price levels while long-term holders are absorbing supply.
In prior cycles, convergence entry points, marked by cyan stars on the chart, appeared at $170 in 2015, $3,300 in 2018, and $16,000 in 2022. Each marked the onset of the final bottoming phase. No convergence entry signal has appeared in the current cycle.
This metric provides one of the clearest structural arguments that the cycle bottom has not yet formed. The direction and pace of convergence are both healthy, but the destination has not been reached.
Assessment: The spread is narrowing at a healthy velocity, but convergence has not occurred. This is the single clearest signal that the cycle bottom remains ahead of us, not behind.
Risk Dashboard: The Composite View
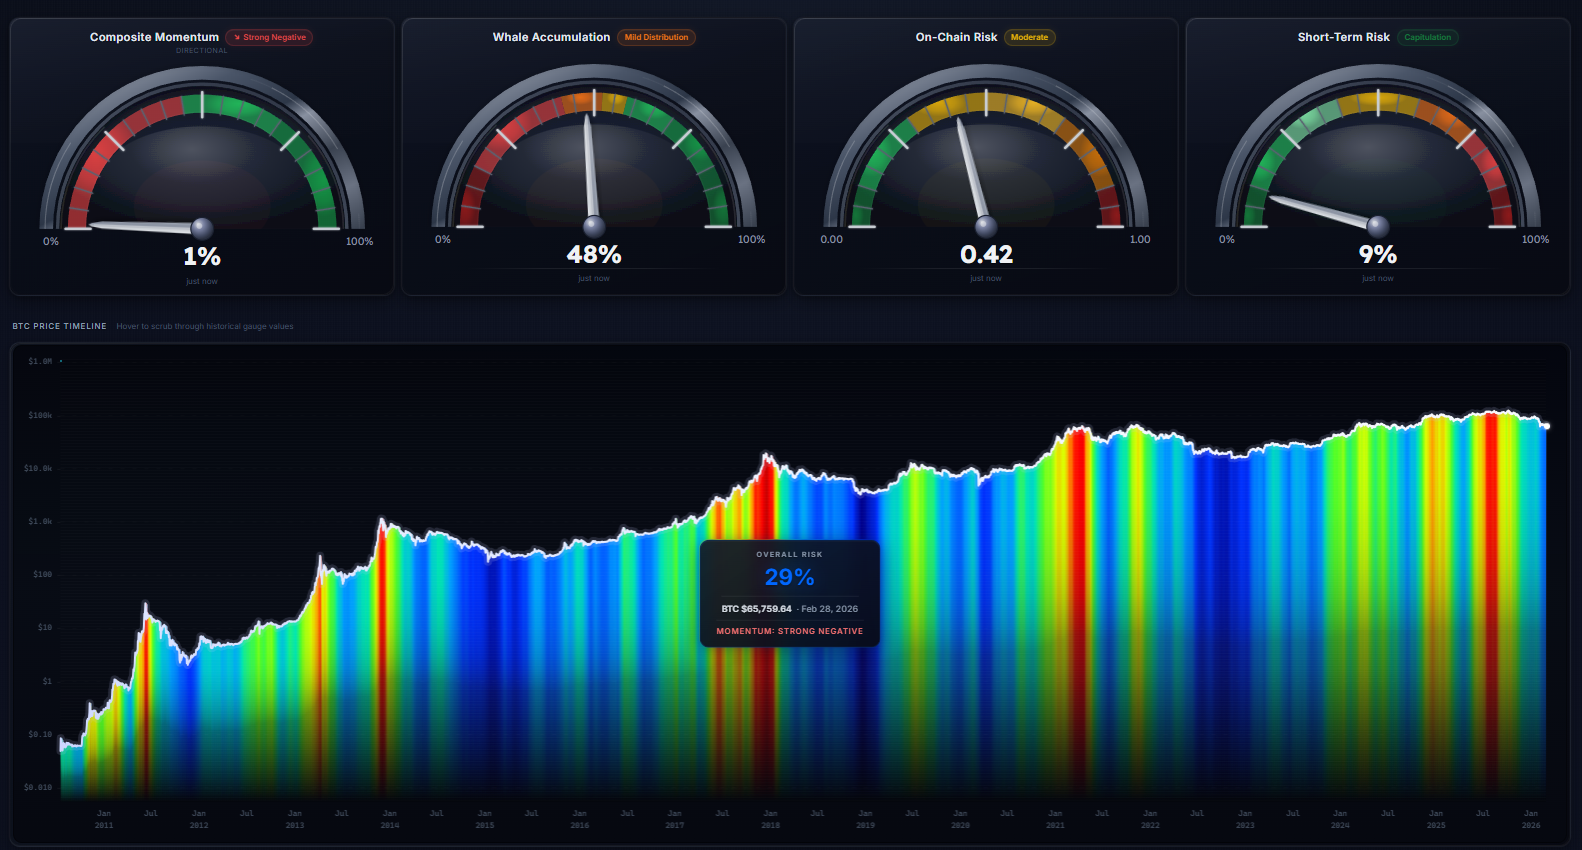
The ChartInspect Risk Dashboard aggregates multiple on-chain dimensions into a unified framework, providing an at-a-glance read on market risk across four gauges:
| Gauge | Reading | Label |
|---|---|---|
| Composite Momentum | 1% | Strong Negative |
| Whale Accumulation | 48% | Mild Distribution |
| On-Chain Risk | 0.42 | Moderate |
| Short-Term Risk | 9% | Capitulation |
| Overall Risk | 29% |
The composite picture is consistent with a late-stage drawdown environment. Momentum is unanimously bearish, with every signal negative. Whale accumulation has moderated to mild distribution, consistent with the Accumulation Index readings discussed in last week's video. On-Chain Risk sits in the moderate zone, not yet at the 0.05-0.10 extreme lows that characterized prior cycle bottoms. Short-Term Risk at 9% reflects full capitulation among recent buyers, which makes structural sense with the STH cost basis at ~$89,000 against a spot price of ~$65,500.
At 29% overall risk, the DCA Allocation Curve (with default thresholds: buy below 40%, sell above 95%) outputs a 2.83x multiplier on the base weekly allocation. The dashboard is flagging this as a favorable accumulation environment, not a confirmed bottom.
The distinction matters. At every prior cycle bottom, the overall risk score dropped into the 5-10% range. At 29%, we're in a low-risk regime that historically rewards accumulation, but there is meaningful distance between the current reading and the zone where bottoms have been confirmed.
Assessment: Low risk, favorable for accumulation. Has not reached the extreme lows (5-10%) present at every prior confirmed cycle bottom.
The Checklist
| Signal | Bottom Condition | Current | Met? |
|---|---|---|---|
| LTH P/L Ratio (7d EMA) | Sustained period below 0.10 | 0.215 | ✗ |
| LTH / Cum. P/L Convergence | Lines pinch together | ~$21K gap | ✗ |
| Supply in Profit/Loss | Converged ~50/50 for 1-2 months | 1 day | ✗ |
| MVRV Divergence (1yr) | Deeply negative (<-20) | -0.3 | ✗ |
| Cost Basis Convergence | STH/LTH within 10% | +109.8% spread | ✗ |
| Risk Dashboard | Overall at 5-10% | 29% | ✗ |
0 out of 6 conditions fully met.
This does not mean the market is destined for significantly lower prices. What it means is that the structural conditions which have historically preceded every cycle bottom are not yet in place. Every metric is moving in the right direction: capitulation is building, profitability is compressing, cost bases are converging, and risk is declining. But none have reached the thresholds that, in every prior cycle, marked the point of maximum opportunity.
The market is closer to the bottom than most participants realize. It is also further from confirmation than many hope. The most probable path from here involves continued consolidation between $55,000 and $70,000, with a potential retest of the realized price near $55,000 before these structural conditions are fully satisfied.
Practical Takeaways
For long-term accumulators, the current risk environment at 29% has historically rewarded disciplined buying. Dollar-cost averaging through this phase and through a potential move toward $55K has been the correct strategy in every prior cycle without exception. The Risk Dashboard's allocation curve reflects this positioning.
For those seeking confirmation before adding significant exposure, the key triggers to monitor are:
- LTH P/L Ratio (7d EMA) dropping below 0.10, which signals peak capitulation among conviction holders
- Supply in Profit/Loss sustaining convergence for weeks, confirming sell-side exhaustion, not just a temporary touch
- Cost Basis Convergence entry signal (cyan star), marking the structural reset of market-wide cost bases
When multiple of these signals fire in proximity, the data will have provided as close to a confirmed cycle bottom as on-chain analysis can offer.
All charts referenced in this article are available at ChartInspect. The LTH Realized P/L Ratio, Supply in Profit & Loss, and Price vs. MVRV Divergence are free charts. Cost Basis Convergence and the Risk Dashboard are available for PRO subscribers.
Join the Telegram community for real-time discussion.
Subscribe to Chart Inspect Research to receive this newsletter every Saturday.
Not financial advice. Always do your own research.
Enjoyed this article?
Subscribe to get the latest research in your inbox.
Comments
Sign in to join the discussion.