Introducing the Accumulation Index
A new proprietary on-chain metric that tracks whether Bitcoin holder cohorts are accumulating or distributing, with per-cohort breakdowns from Shrimp to Humpback.

Today I'm releasing a new chart on ChartInspect that I've been building out for a while: the Accumulation Index. It's a proprietary on-chain metric designed to answer a straightforward question, are Bitcoin holders accumulating or distributing right now, and which ones?
The implementation, and data pipeline, are all built from scratch using ChartInspect's own on-chain node.
What It Does
The Accumulation Index tracks six distinct holder cohorts based on their on-chain balance size:
| Cohort | Balance Range | Who They Are |
|---|---|---|
| Shrimp | <1 BTC | Retail investors |
| Crab | 1-10 BTC | Small holders |
| Fish | 10-100 BTC | Medium holders |
| Shark | 100-1K BTC | Large holders |
| Whale | 1K-10K BTC | Very large holders |
| Humpback | >10K BTC | Mega whales |
For each cohort, the index looks at how their on-chain balances have shifted over recent days relative to their share of total supply. Cohorts holding a larger portion of the supply carry more weight in the overall score, meaning whale-level movements naturally have a bigger impact than retail. Each cohort's score gets normalized over a rolling window to produce a clean 0-100% reading that adapts across different market conditions.
The end result is a single composite signal telling you whether the market as a whole is in accumulation or distribution mode.
Tracks whether Bitcoin holder cohorts (Shrimp to Humpback) are accumulating or distributing by analyzing changes in on-chain balance distribution over time.
on-chain-metrics / accumulation-index
Each cohort is scored individually, then combined into a composite 0-100% signal weighted by market valuation context. Displayed as colored phase dots on the BTC price line, with selectable cohort views. Created by Tristan Colt.
chartinspect.com
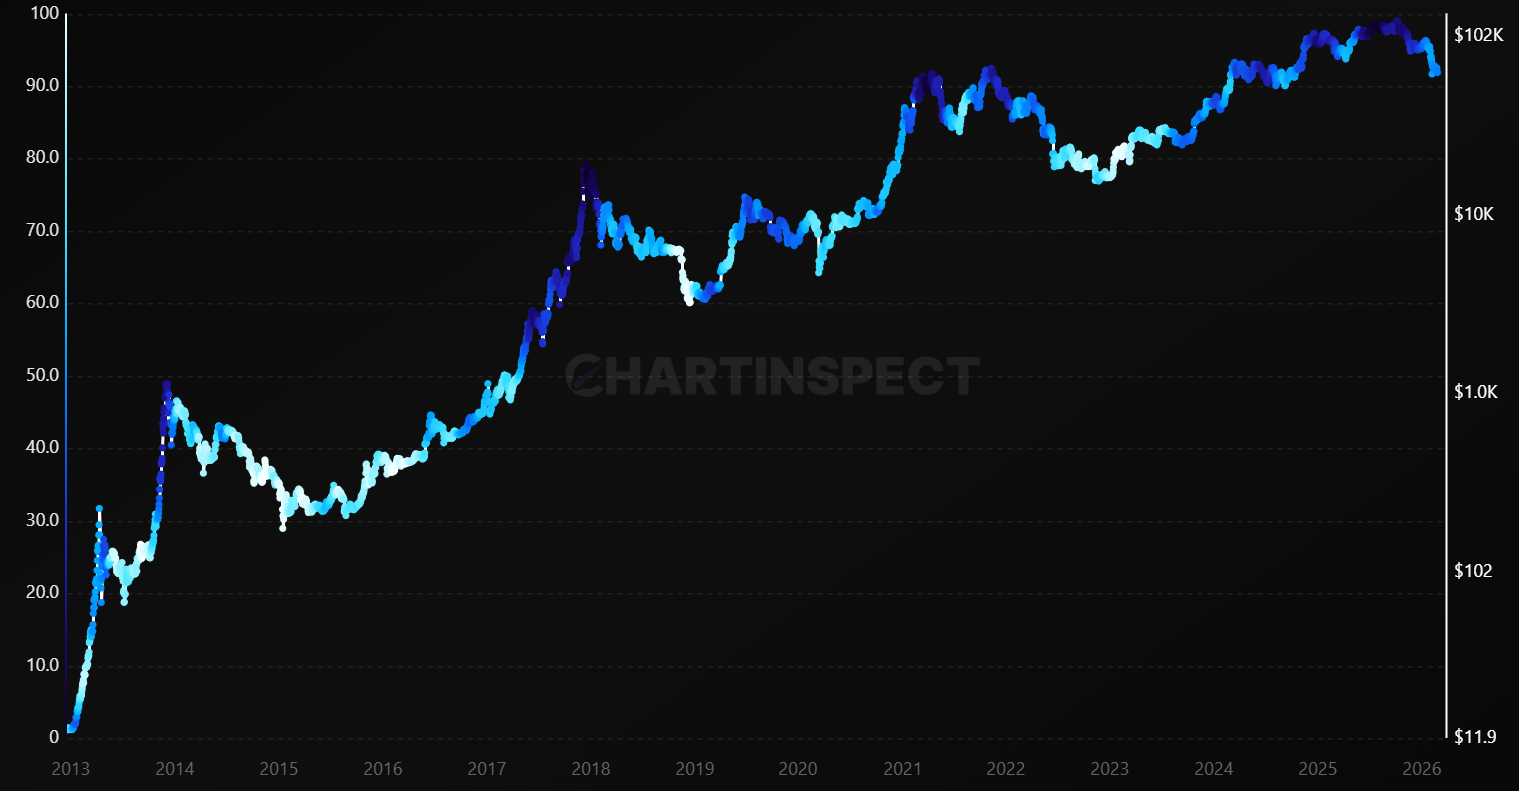
Reading the Chart
The chart overlays colored phase dots directly on the BTC price line. Each dot's color represents the accumulation score at that point in time:
- Above 85% (Extreme Accumulation): Near-unanimous accumulation across cohorts. These readings are rare and have historically lined up with capitulation bottoms.
- 70-85% (Strong Accumulation): Broad accumulation, often seen near market bottoms or in early bull phases.
- 55-70% (Accumulating): Most cohorts are adding to their positions.
- 45-55% (Neutral): Mixed behavior, no clear trend.
- 30-45% (Distributing): Most cohorts are reducing their positions.
- 15-30% (Strong Distribution): Broad distribution, typically during euphoric tops or heavy selling pressure.
- Below 15% (Extreme Distribution): Near-unanimous selling, rare blow-off tops or panic events.
The color scheme is fully customizable in the chart controls. You can pick from colorblind-safe palettes, diverging schemes, single-hue gradients, or hard binary splits depending on your preference.
Per-Cohort Breakdown
This is where things get interesting. The Accumulation Index gives you a composite score by default, but you can also use the Cohort dropdown to isolate any individual holder group.
Want to see if whales are accumulating while shrimp are distributing? Select "Whale (1K-10K BTC)" and the entire chart switches over, phase dots, smoothing, tooltip, all of it reflecting that specific cohort's behavior.
These kinds of divergences between cohorts are often some of the most useful signals in on-chain data. When large holders are quietly accumulating while retail is panic selling, that's historically been a strong setup. The reverse, retail piling in while whales distribute, tends to precede corrections.
Whale Cohort: The Smart Money Signal
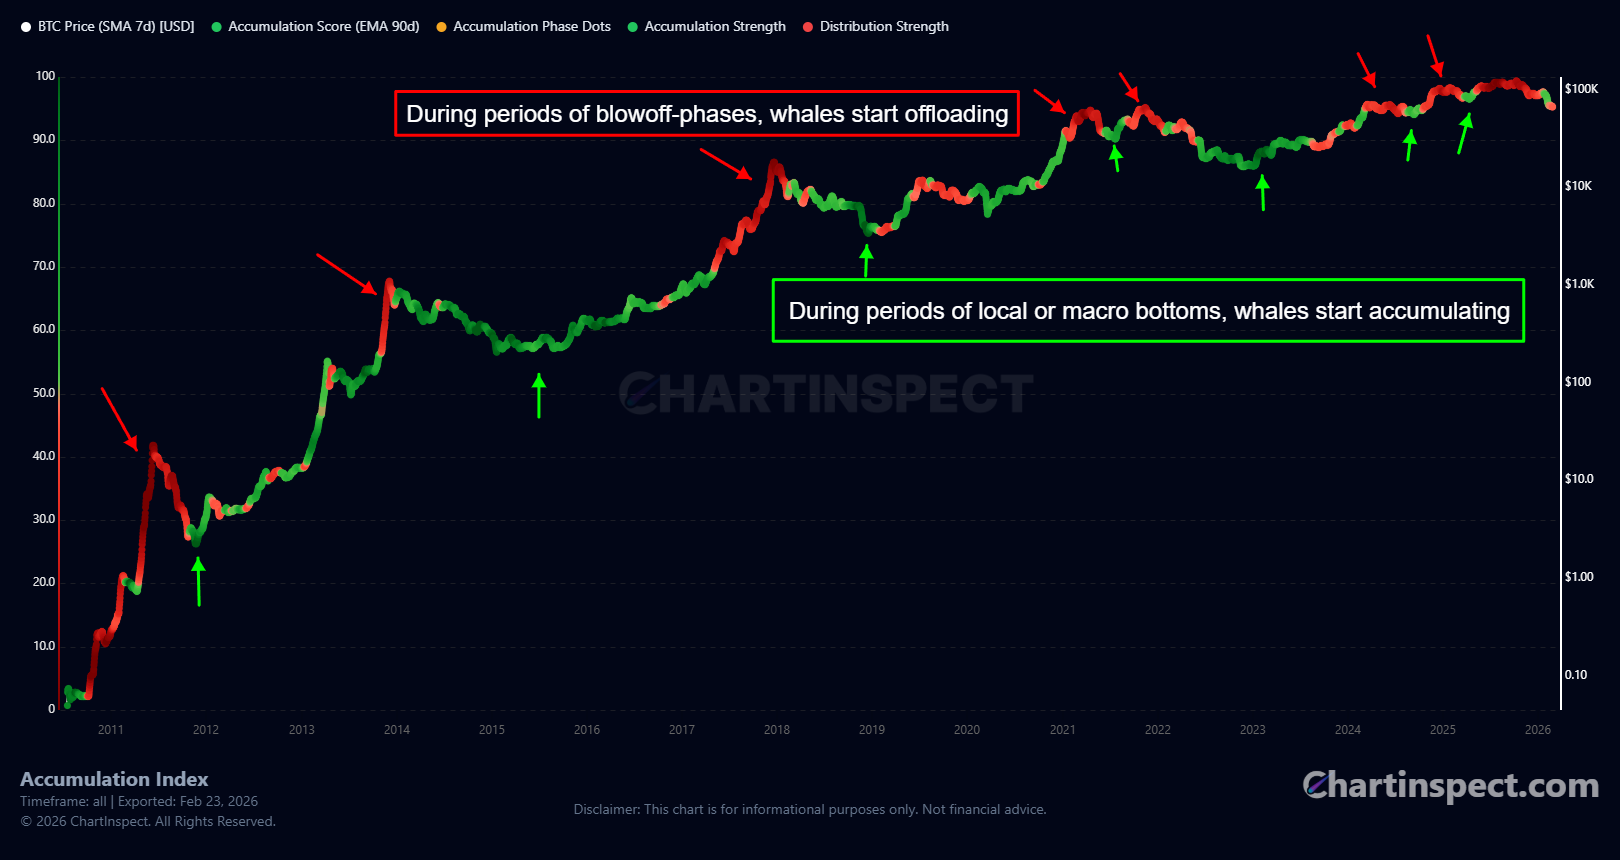
Isolating the Whale cohort (1K-10K BTC) reveals something striking. These holders have a remarkably consistent track record of distributing near cycle tops and accumulating near bottoms. Look at every major peak: the 2013 double top, the 2017 blow-off, April and November 2021, and even October 2025 top. Each time, the whale cohort's phase dots shift to red before or right at the peak, while the rest of the market is still euphoric.
The pattern at bottoms is equally clear. During the 2015 grind, the 2018-2019 capitulation, March 2020, and the FTX collapse in late 2022, whales were deep green, steadily absorbing supply that weaker hands were dumping. They don't time the exact bottom to the day, but their sustained accumulation during drawdowns has preceded every major bull run in Bitcoin's history.
If there's one cohort worth keeping an eye on in the Accumulation Index, it's this one.
Net Position Bars
Toggle on the Net Position Bars in the legend to see a histogram view of the accumulation score. Green bars appear when the score is above 50% (accumulation), red bars when it's below 50% (distribution). The taller the bar, the more conviction in that direction.
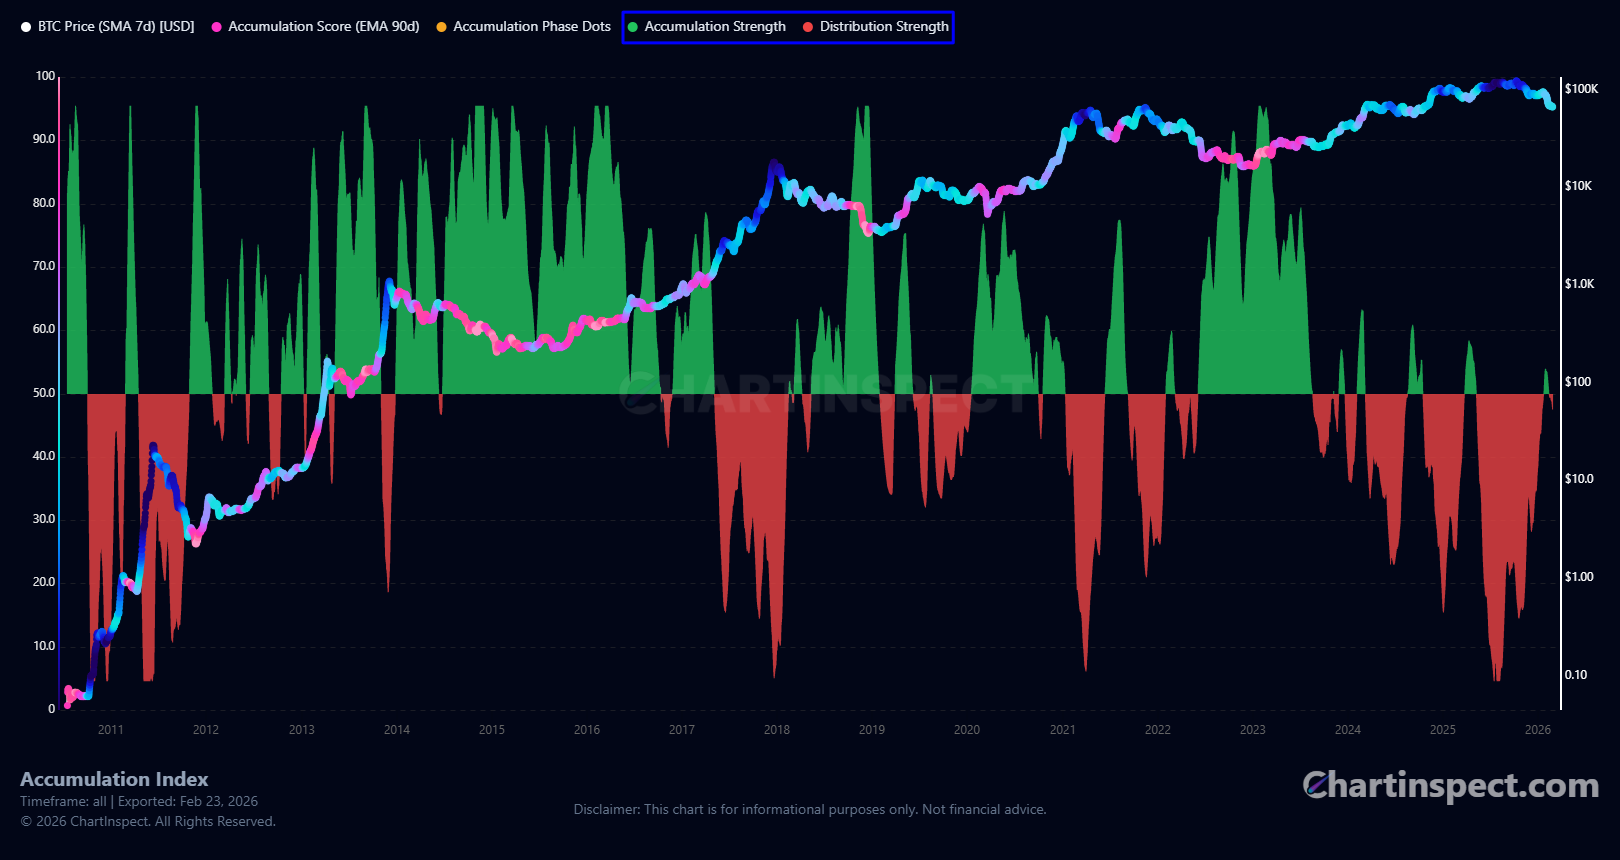
Think of it as a quick visual summary. At a glance, you can see when holders were aggressively accumulating or distributing, and how strong that conviction was at any given point.
Historical Context
Looking back at Bitcoin's history through this lens, some clear patterns emerge:
Cycle bottoms consistently show up as periods of extreme accumulation (85%+). The 2015 bottom, the late 2018 capitulation, March 2020, and the November 2022 FTX bottom all registered prolonged stretches of high accumulation scores. These are the windows where conviction holders were absorbing supply from capitulating sellers.
Cycle tops are the mirror image. The 2017 blow-off top, the April 2021 peak, and the November 2021 top all saw the index drop into strong distribution territory as cohorts across the board were taking profits.
Mid-cycle corrections tend to show up as brief dips into distribution followed by quick recoveries back into accumulation, which helps distinguish them from genuine trend reversals.
How to Use It
The Accumulation Index works best as a confluence tool alongside other on-chain metrics. Here's how I think about it:
-
Identify the regime. Is the overall score in accumulation or distribution territory? This sets the macro backdrop.
-
Check for divergences. Use the cohort selector to see if different holder sizes agree or disagree. Unanimous behavior across cohorts is a stronger signal than mixed readings.
-
Watch for transitions. The most actionable moments tend to be when the score crosses from distribution into accumulation (potential bottoming) or from accumulation into distribution (potential topping).
-
Combine with valuation metrics. Pair it with MVRV, AVIV NUPL, or the Realized Price to put the accumulation behavior in context, whether it's happening at historically cheap or expensive levels.
Available Now for PRO Users
The Accumulation Index is live on ChartInspect.com as part of the PRO chart suite. You'll find it under On-Chain Metrics > Supply Dynamics.
PRO users get:
- Full interactive chart with all color schemes and smoothing options
- Per-cohort breakdown via the Cohort dropdown
- Net Position Bars toggle
- Block-time data updates (roughly every 10 minutes)
- Custom alerts when the score crosses key thresholds
If you have feedback, feature requests, or ideas for how you'd like to use this, drop a comment below or reach out in the PRO Telegram group.
Not financial advice. Always do your own research.
Thanks for reading. See you in the next one.
Enjoyed this article?
Subscribe to get the latest research in your inbox.
Comments
Sign in to join the discussion.