Pressure, Not Panic
The pullback is hurting Bitcoin's newest buyers while long-term holders sit tight. Recent-buyer losses, leverage returning on the dip, $306B of stablecoins on the sidelines, and what the same charts say about Ethereum.

The pullback is hurting the people who bought most recently. Most of the rest of the market is sitting on profit and doing very little. That gap is what this newsletter is about.
In this week's video I explained why I'm not turning bearish: nothing on chain looks euphoric, profit-taking is a fraction of past tops, and the ETFs keep absorbing more than miners produce. I won't repeat all of that here. Instead I want to walk through four things I didn't have time for: who is actually under pressure, what leverage is doing on the dip, how much cash is waiting on the sidelines, and what the same charts say about Ethereum.
All figures are daily closes through October 15, 2026, with September 23 as the comparison point, the last time I wrote about the levels.
First, a quick recap of the levels
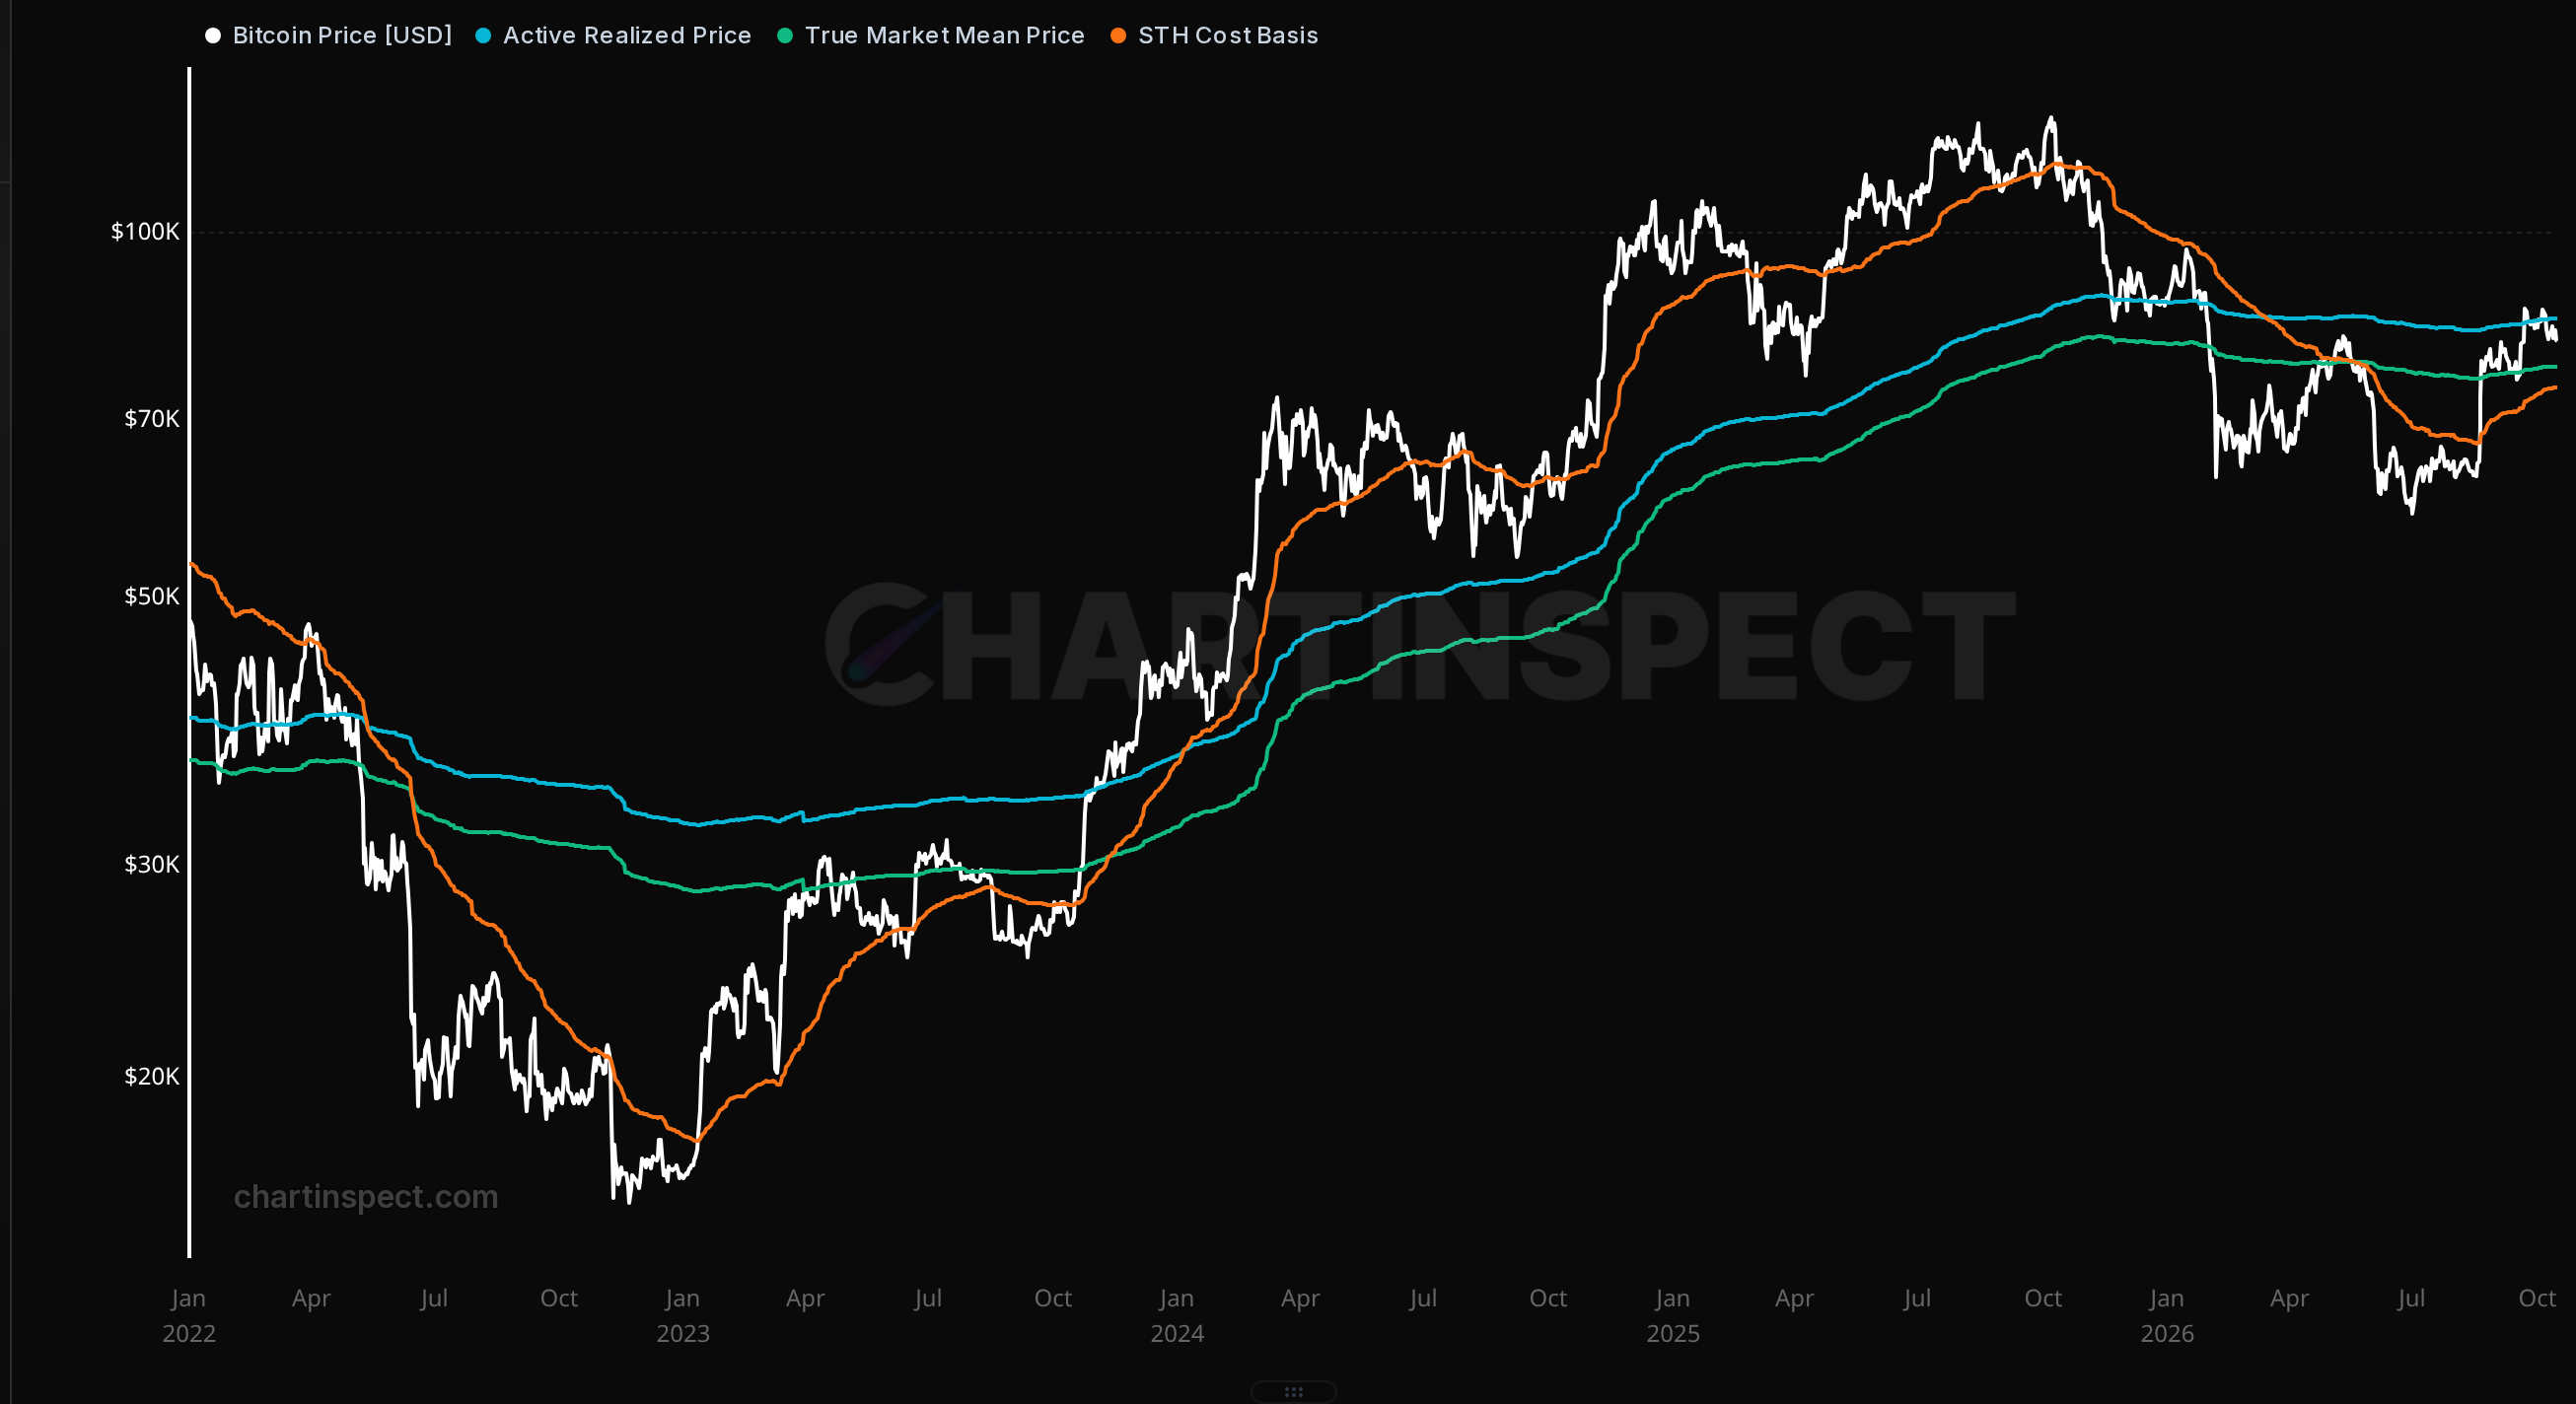
Bitcoin closed October 15 at $81,591. Three levels matter to me right now:
-
Active realized price, $84,968. This is the average cost of coins that are still moving. Bitcoin is about 4% below it, so the recovery above it has been lost for now.
-
True Market Mean, $77,528. A cost basis that strips out long-dormant coins. Price is about 5% above it.
-
Short-term holder cost basis, $74,504. The average price paid by coins that changed hands in roughly the last five months. Price is about 9.5% above it.
As long as Bitcoin holds above True Market Mean and the short-term holder cost basis, I treat this as a pullback inside a recovery. Losing both and failing to win them back would change my mind.
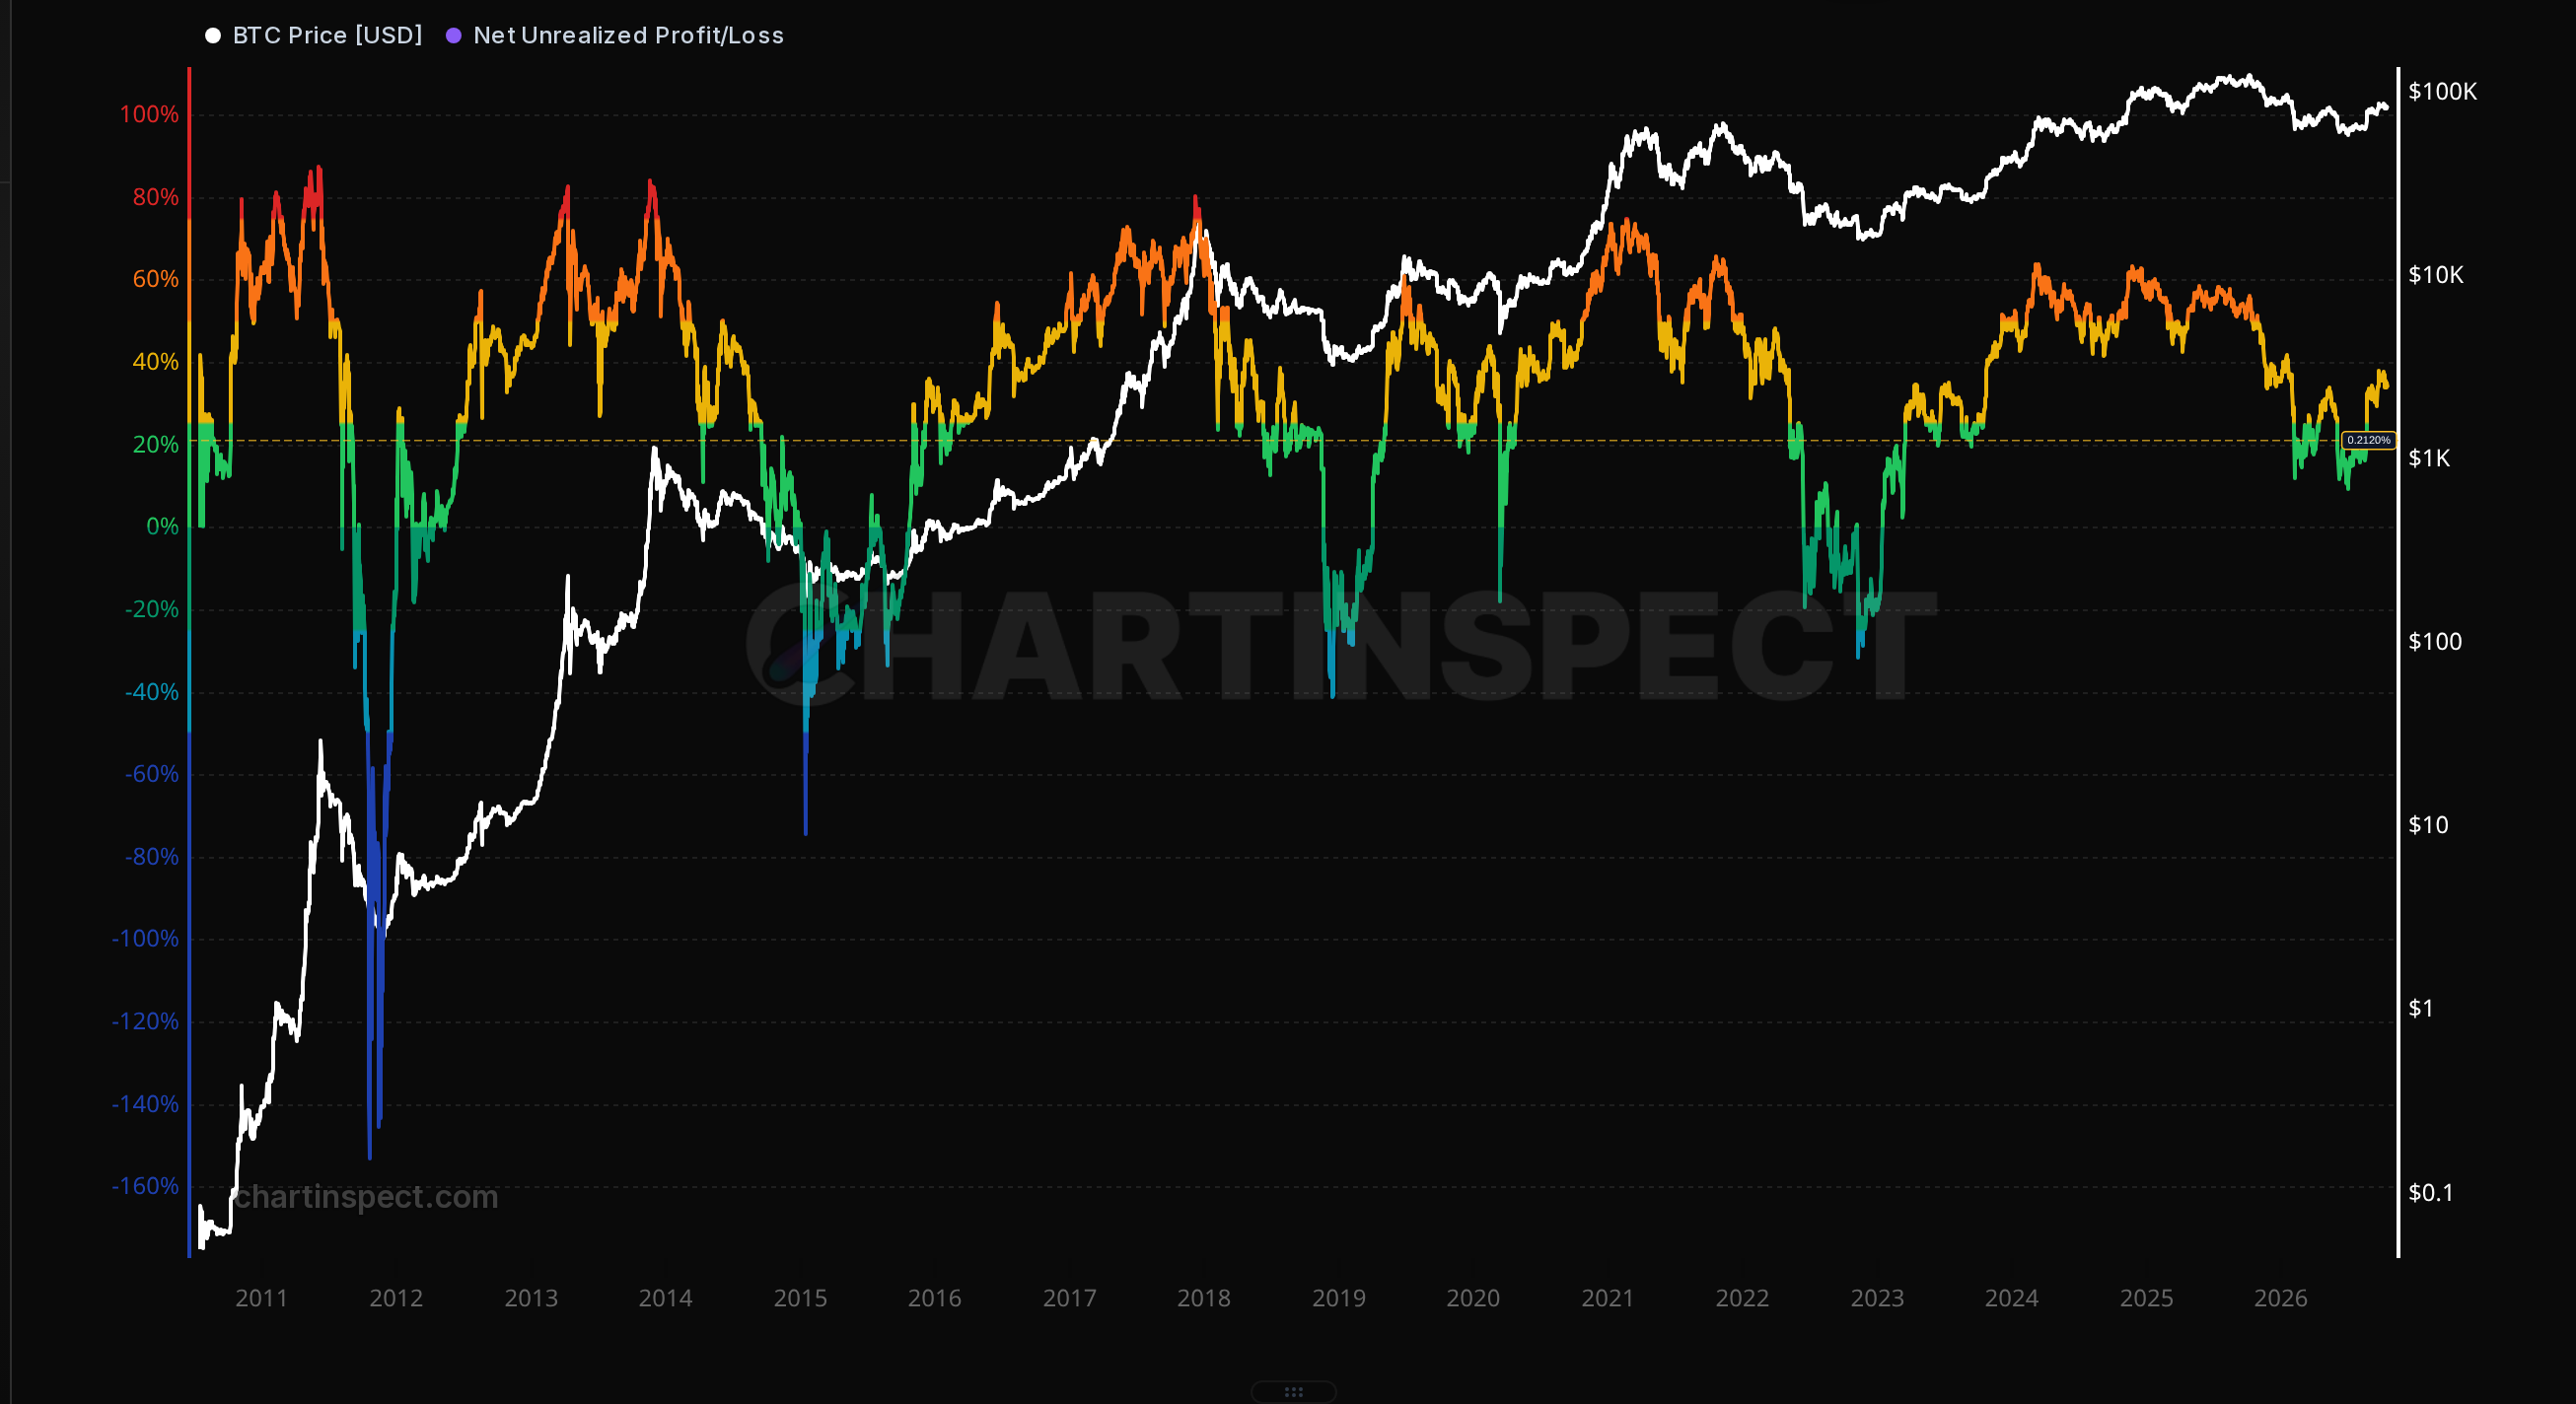
Open Net Unrealized Profit/Loss
Net unrealized profit is 34% of market cap, down from 37.9% on September 23. Holders as a group are still well in profit, and nowhere near the 70% to 80% readings that marked past cycle tops. That was the main point of the video. The rest of this letter is about what sits underneath that average.
Pressure on recent buyers
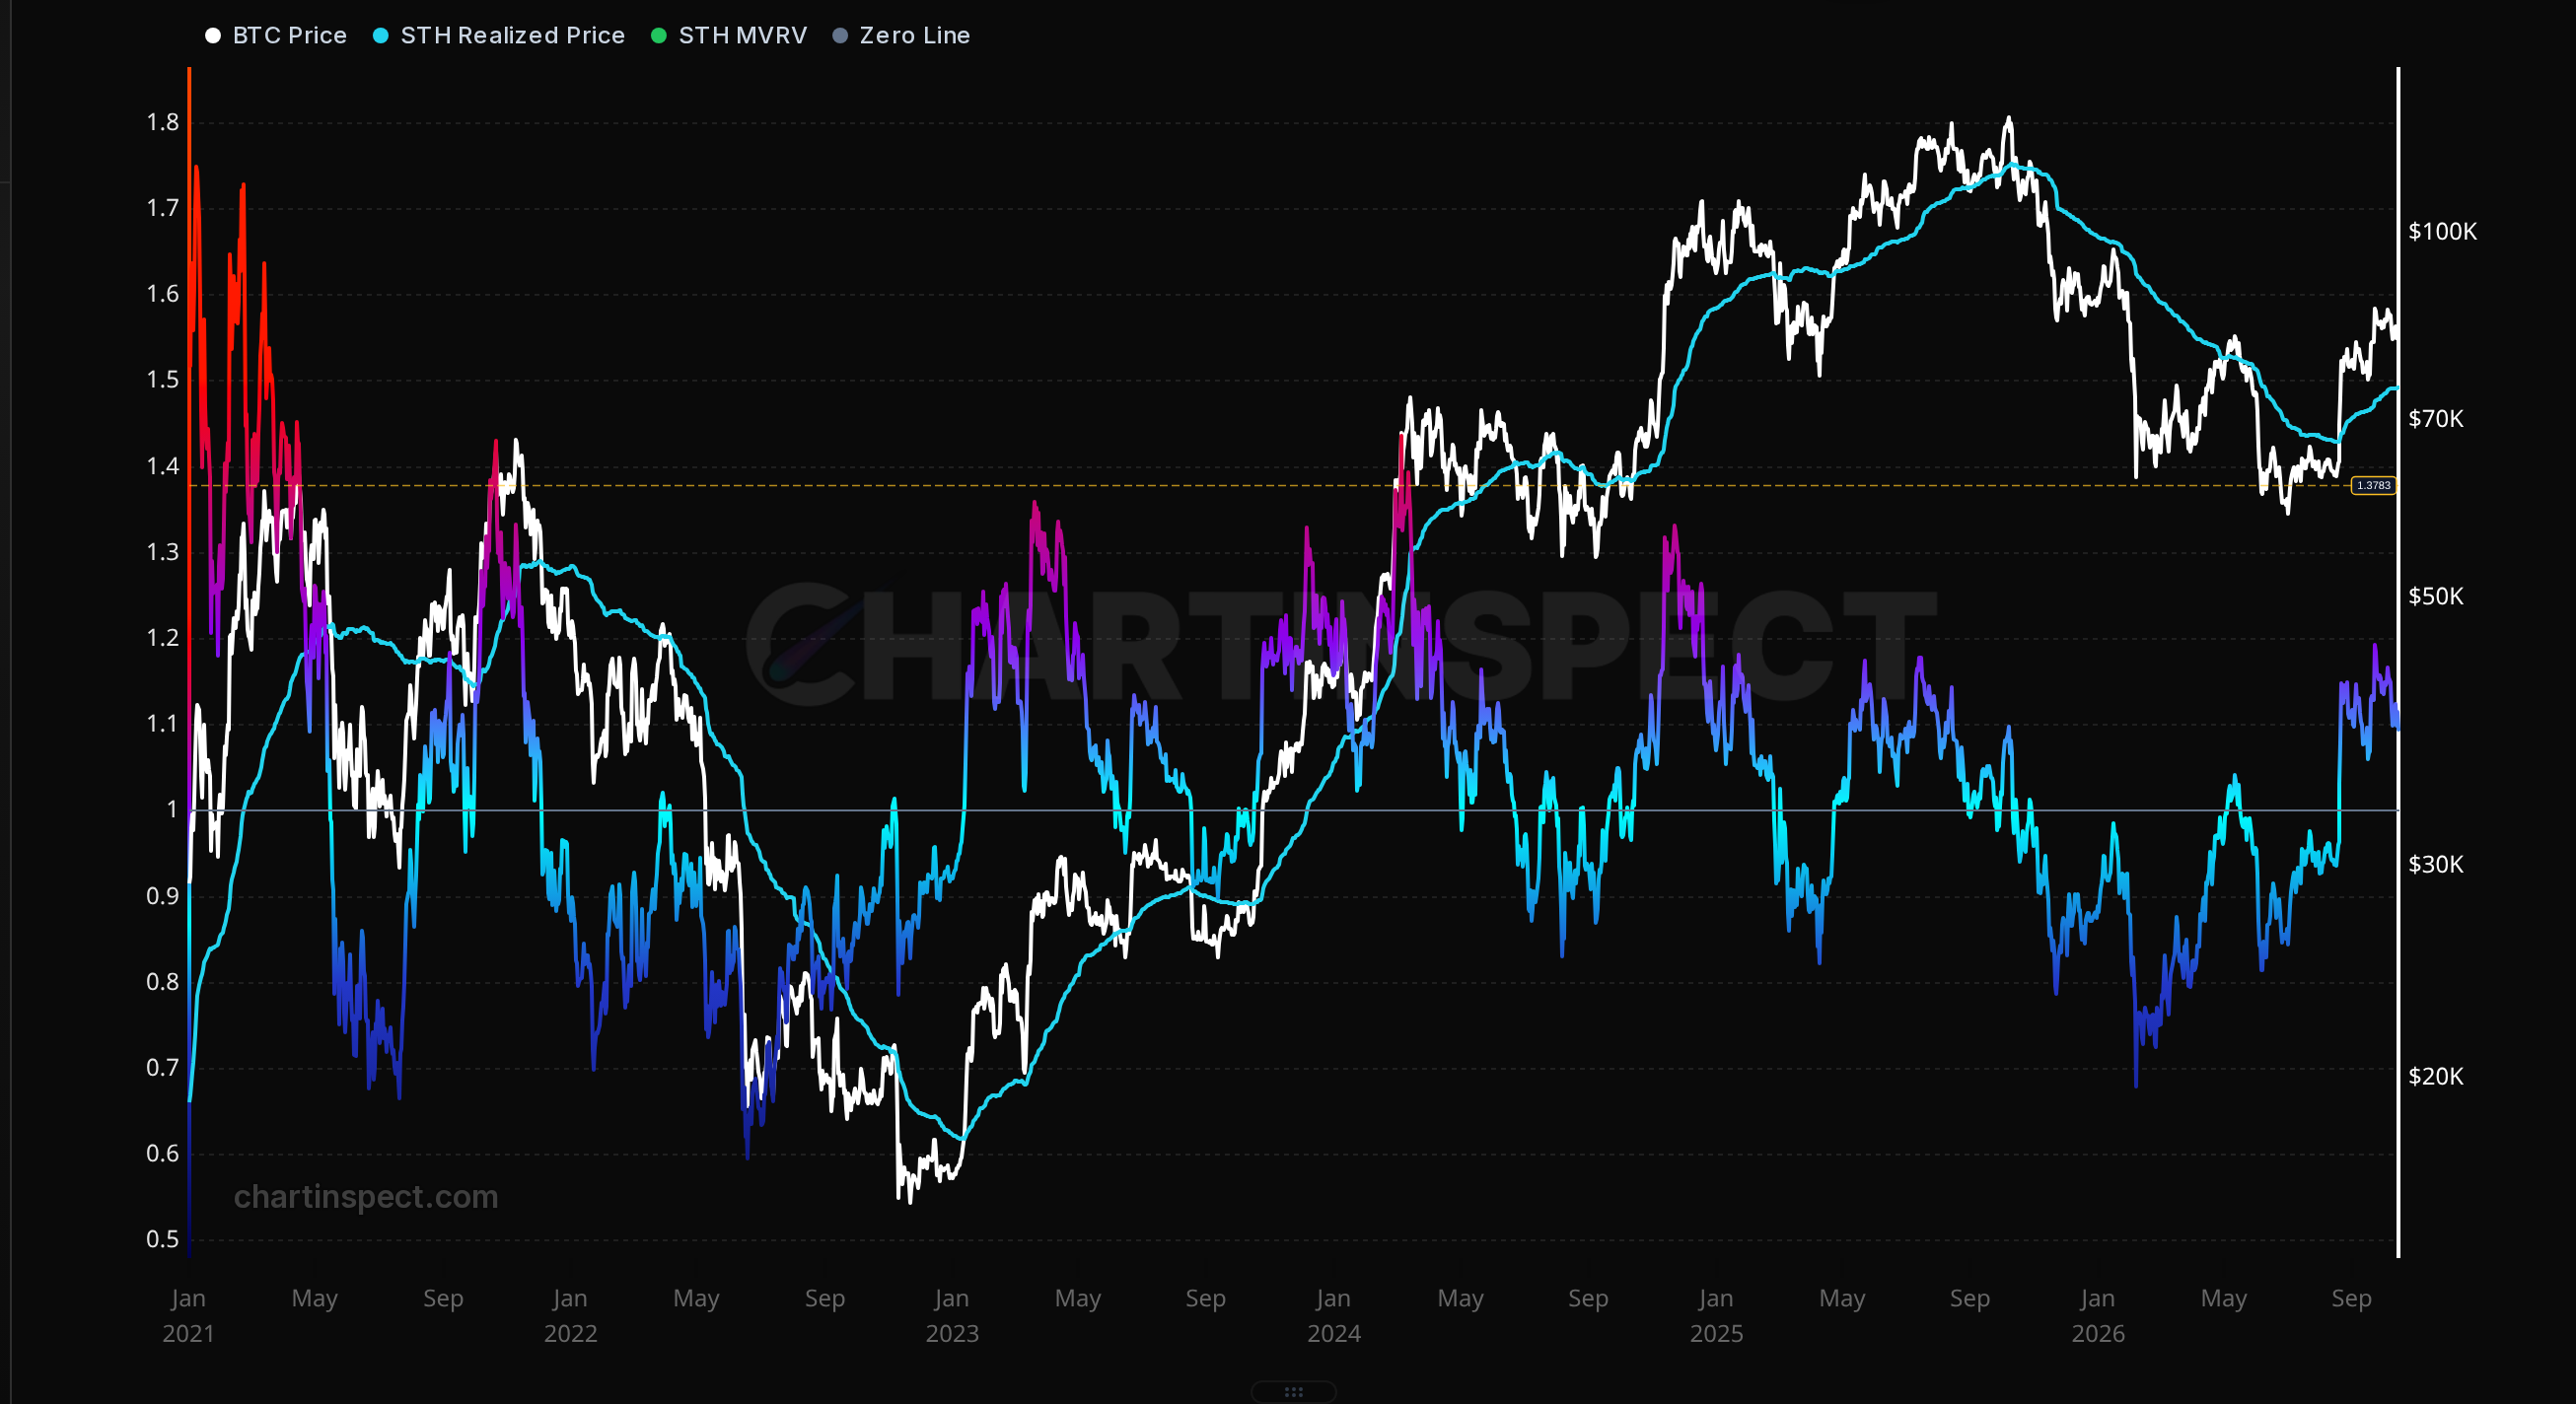
The average hides a big change in one group. Short-term holders, the coins bought in roughly the last five months, have gone from comfortable to stressed in three weeks:
| Short-term holders | Sep 23 | Oct 15 |
|---|---|---|
| Share of their supply in loss | 4.5% | 29.7% |
| BTC held at a loss | 161K | 1.10M |
| Unrealized profit (NUPL) | 0.156 | 0.087 |
Most of the coins bought during the August and September run are now underwater. For context, at the June low 97.5% of short-term holder supply was in loss, so this is nowhere near a capitulation. But it is real pressure.
You can see it in what they do when they sell. On five of the last eight days, short-term holders realized more losses than profits. On October 15 alone they locked in about $302M of losses against $128M of profits. That is what a shakeout looks like: recent buyers selling below what they paid, to people willing to hold through it.
I don't read that as bearish on its own. In 2023 the same thing happened around the short-term holder cost basis before the move higher. The test is whether that selling dries up as price approaches the cost basis, or accelerates through it.
Long-term holders aren't flinching
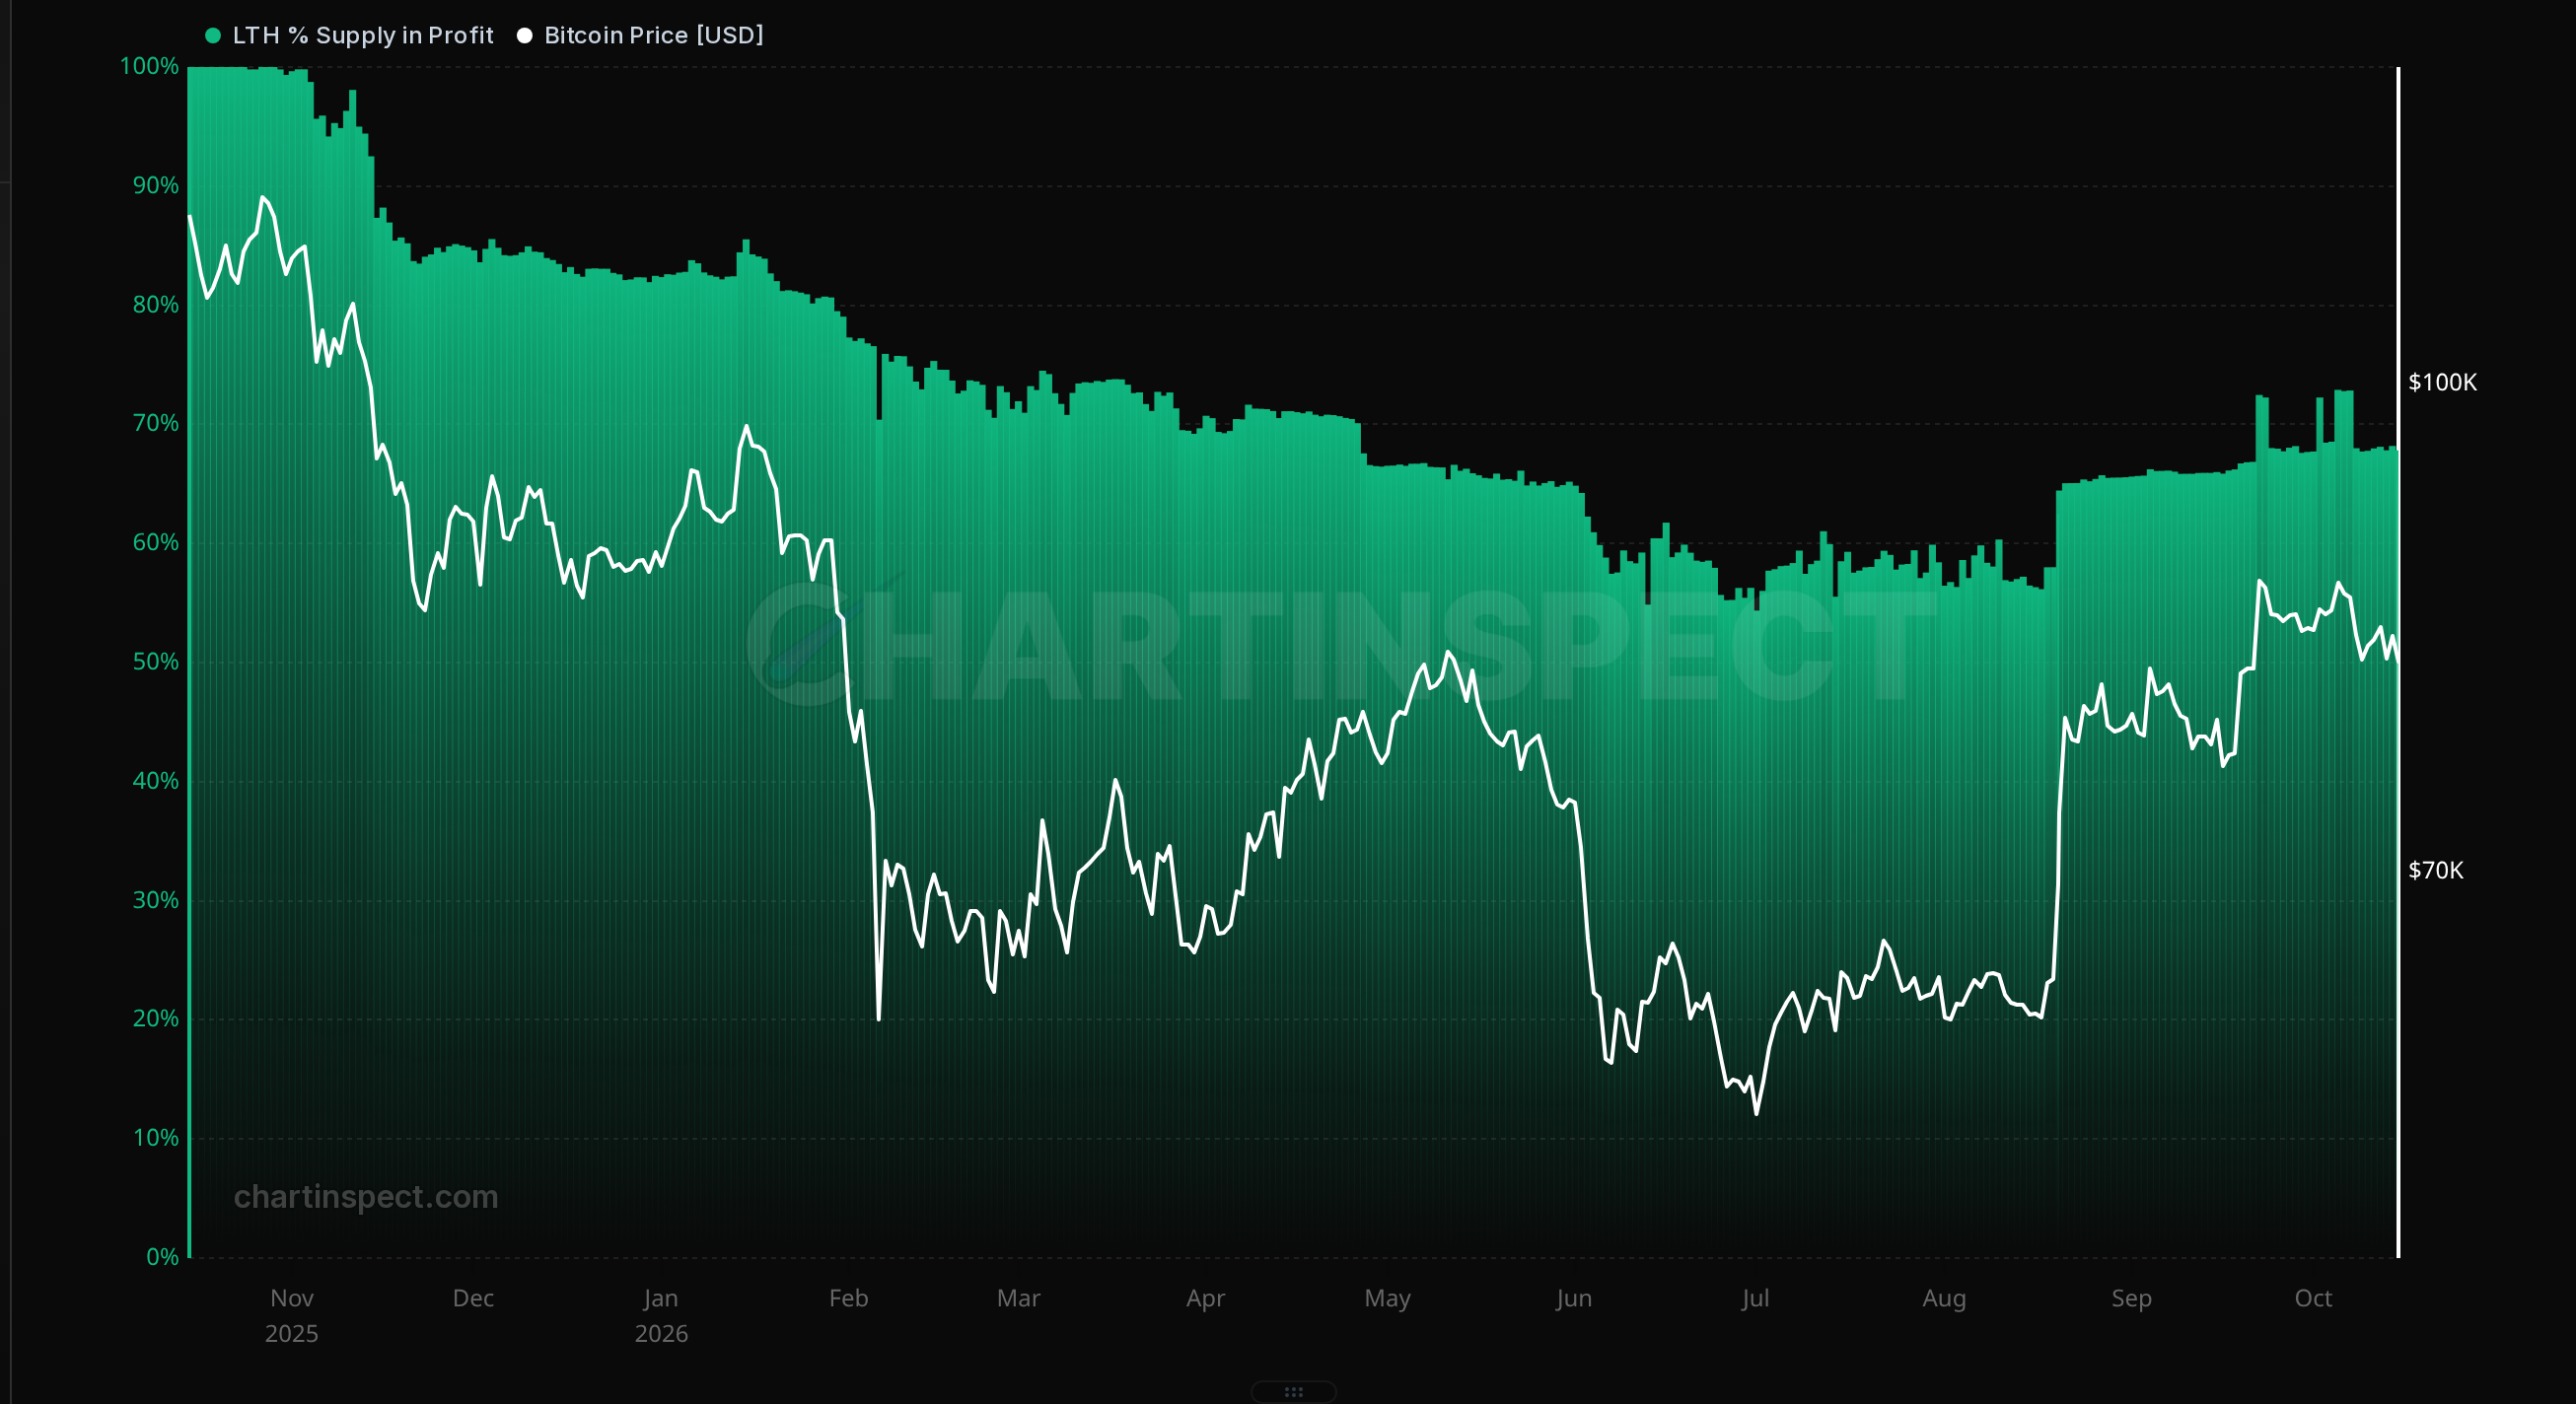
Long-term holders tell a calmer story. About two thirds of their coins are in profit (67.8%, down from 72.3% on September 23), and their unrealized profit barely moved, from 0.428 to 0.398.
One detail is easy to miss. Roughly a third of long-term holder supply is in loss. Those are mostly coins bought near the 2025 highs that have now been held long enough to count as long-term. These people already sat through a drop into the $50Ks and didn't sell. A move to the low $70Ks is unlikely to be the thing that breaks them.
Long-term holders are still net sellers on most days, roughly 15K to 18K BTC on the heavier days this week. That's people with large profits trimming, which has been going on through the whole recovery. It isn't forced selling, and it's small next to what the ETFs have been absorbing.
So the pressure is concentrated in one group, the newest buyers. That is a much healthier place for it to be than in the holders who own most of the supply.
Leverage is creeping back
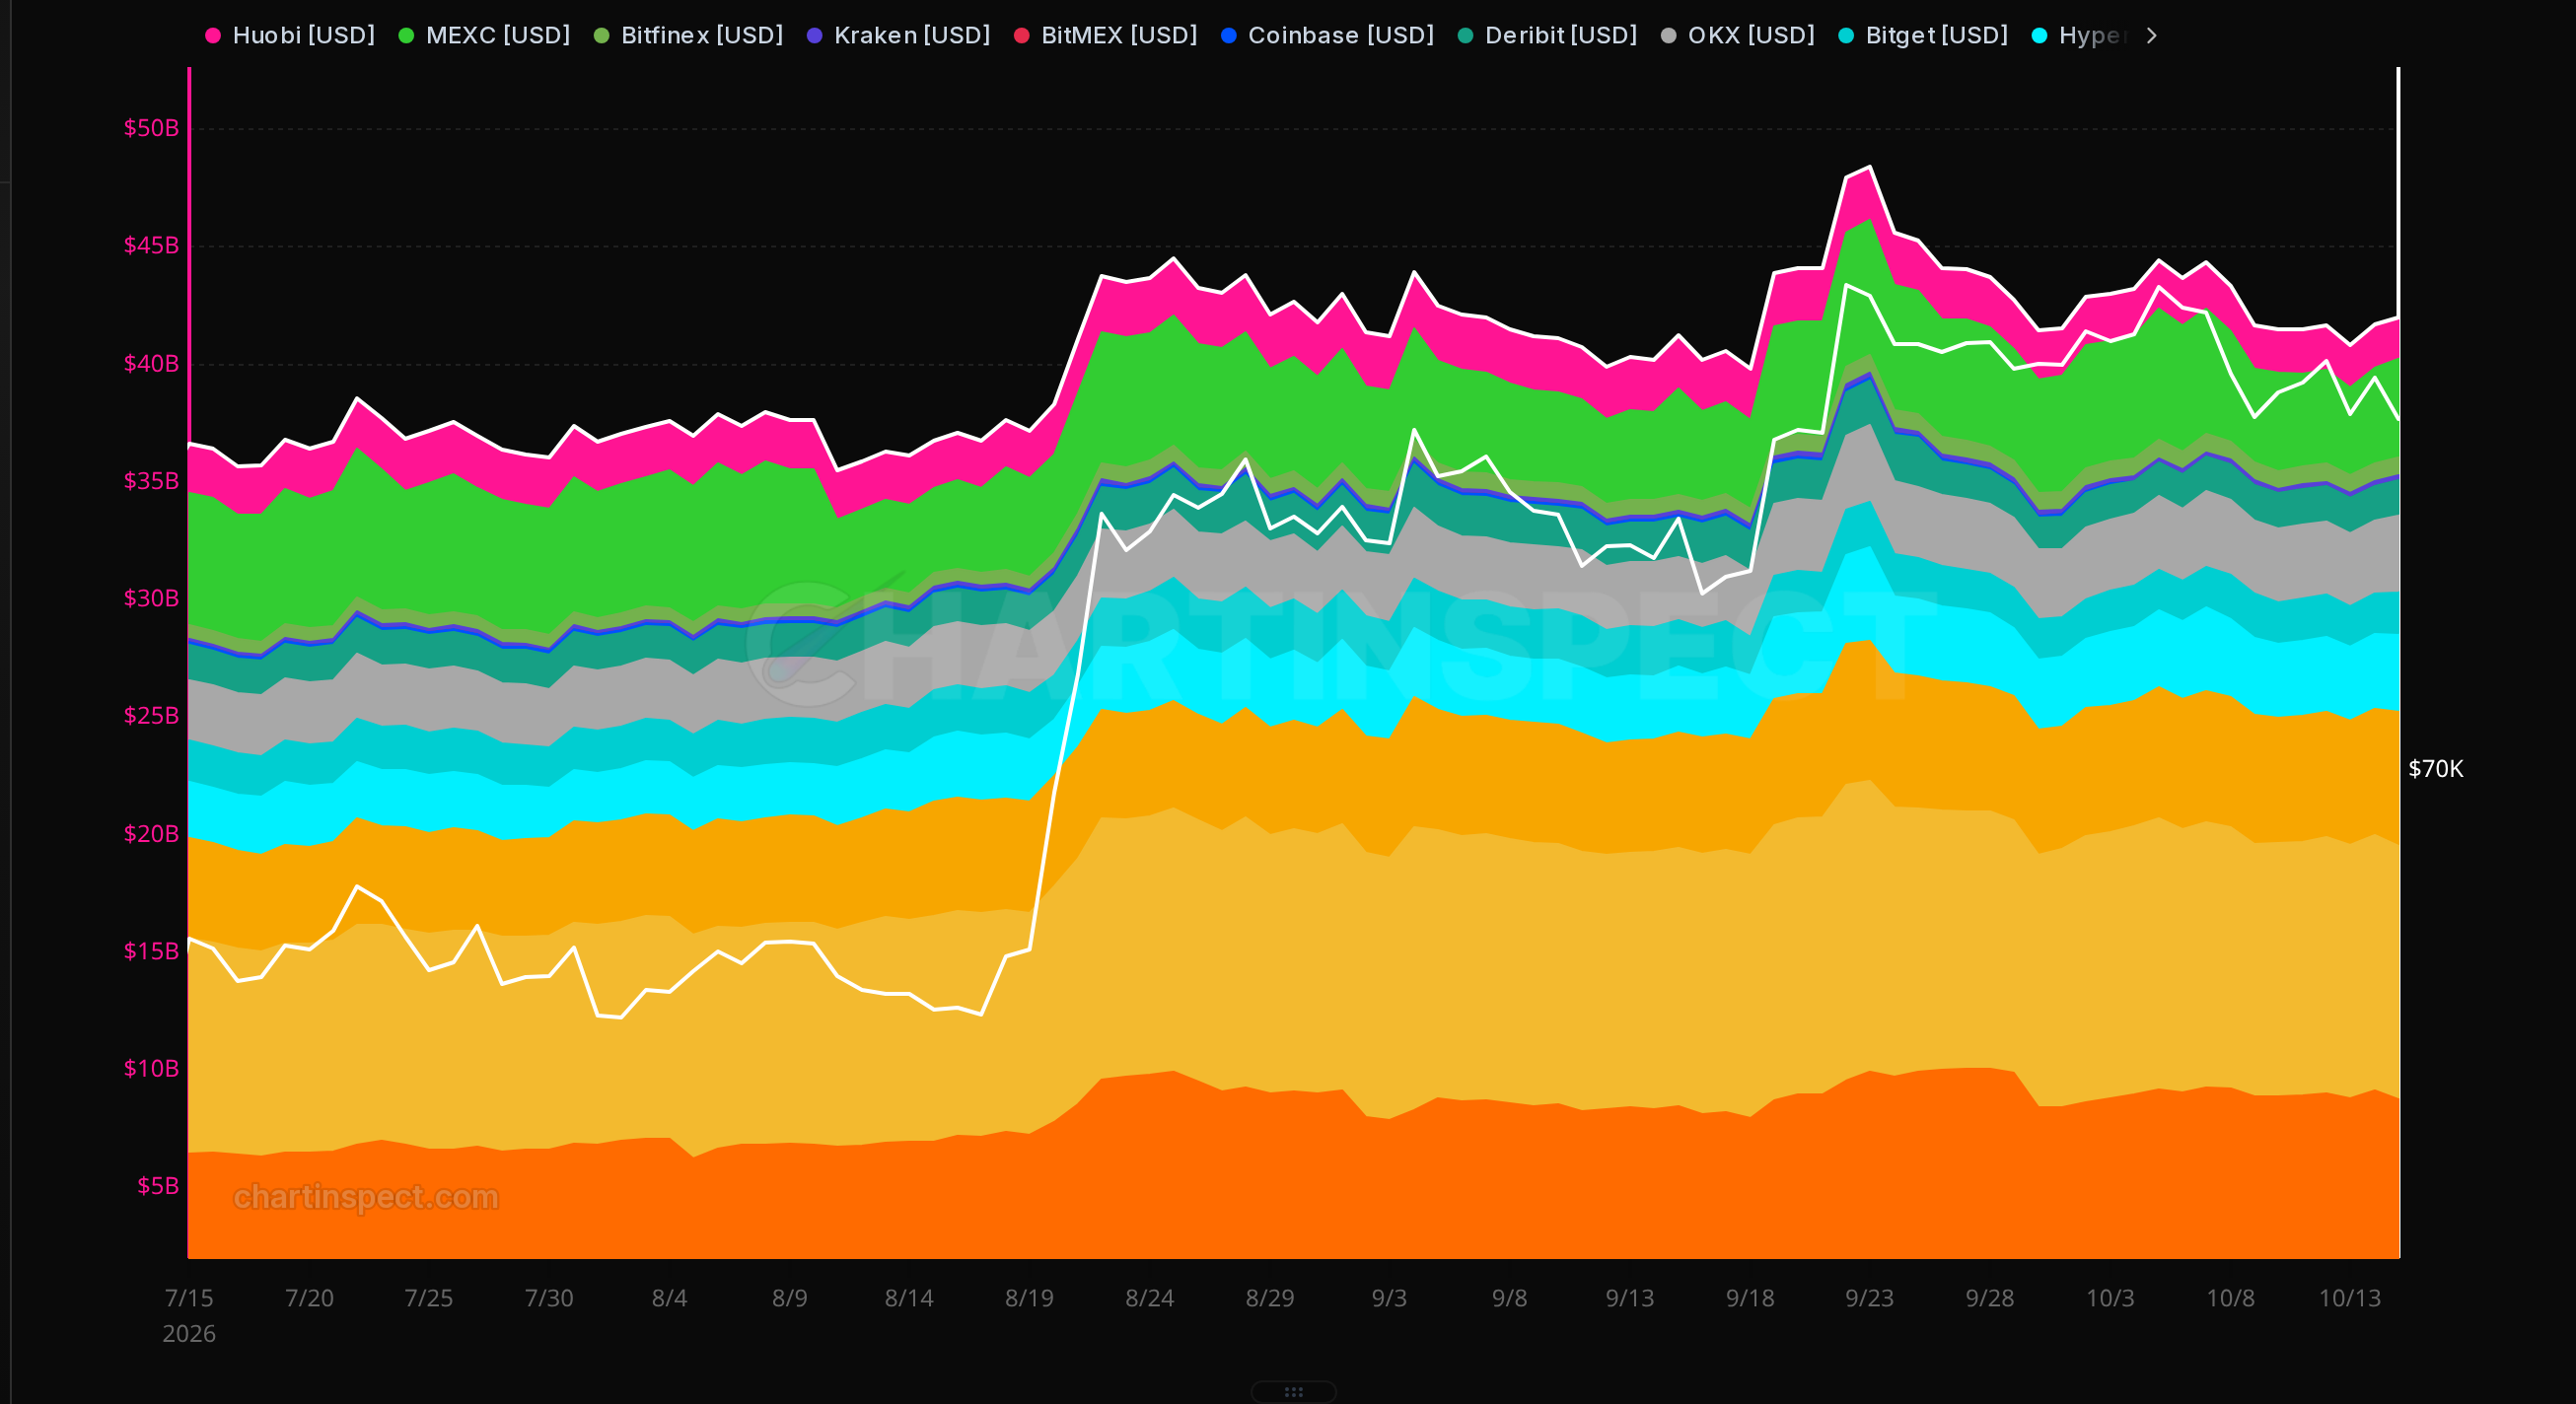
Here's the part I'm keeping a closer eye on. Measured in BTC, so the price drop doesn't distort it, futures open interest across exchanges rose from 497.4K BTC on October 12 to 514.4K BTC on October 15. That's about 17K BTC of new positions in three days while price was falling.
Funding is positive but small, 0.0064% per period versus 0.0026% on September 23, and our derivatives risk reading is low at 0.064. So this isn't a crowded long trade yet. It looks like traders using futures to buy the dip.
Why it matters: leverage that builds on the way down is fuel for a sharper move in either direction. If price holds the cost-basis levels, those longs can help push it back up. If price breaks below the short-term holder cost basis, the same positions become forced sellers, and that's how a pullback turns into a flush. I'd be more comfortable seeing open interest flat while price stabilizes.
$306 billion on the sidelines
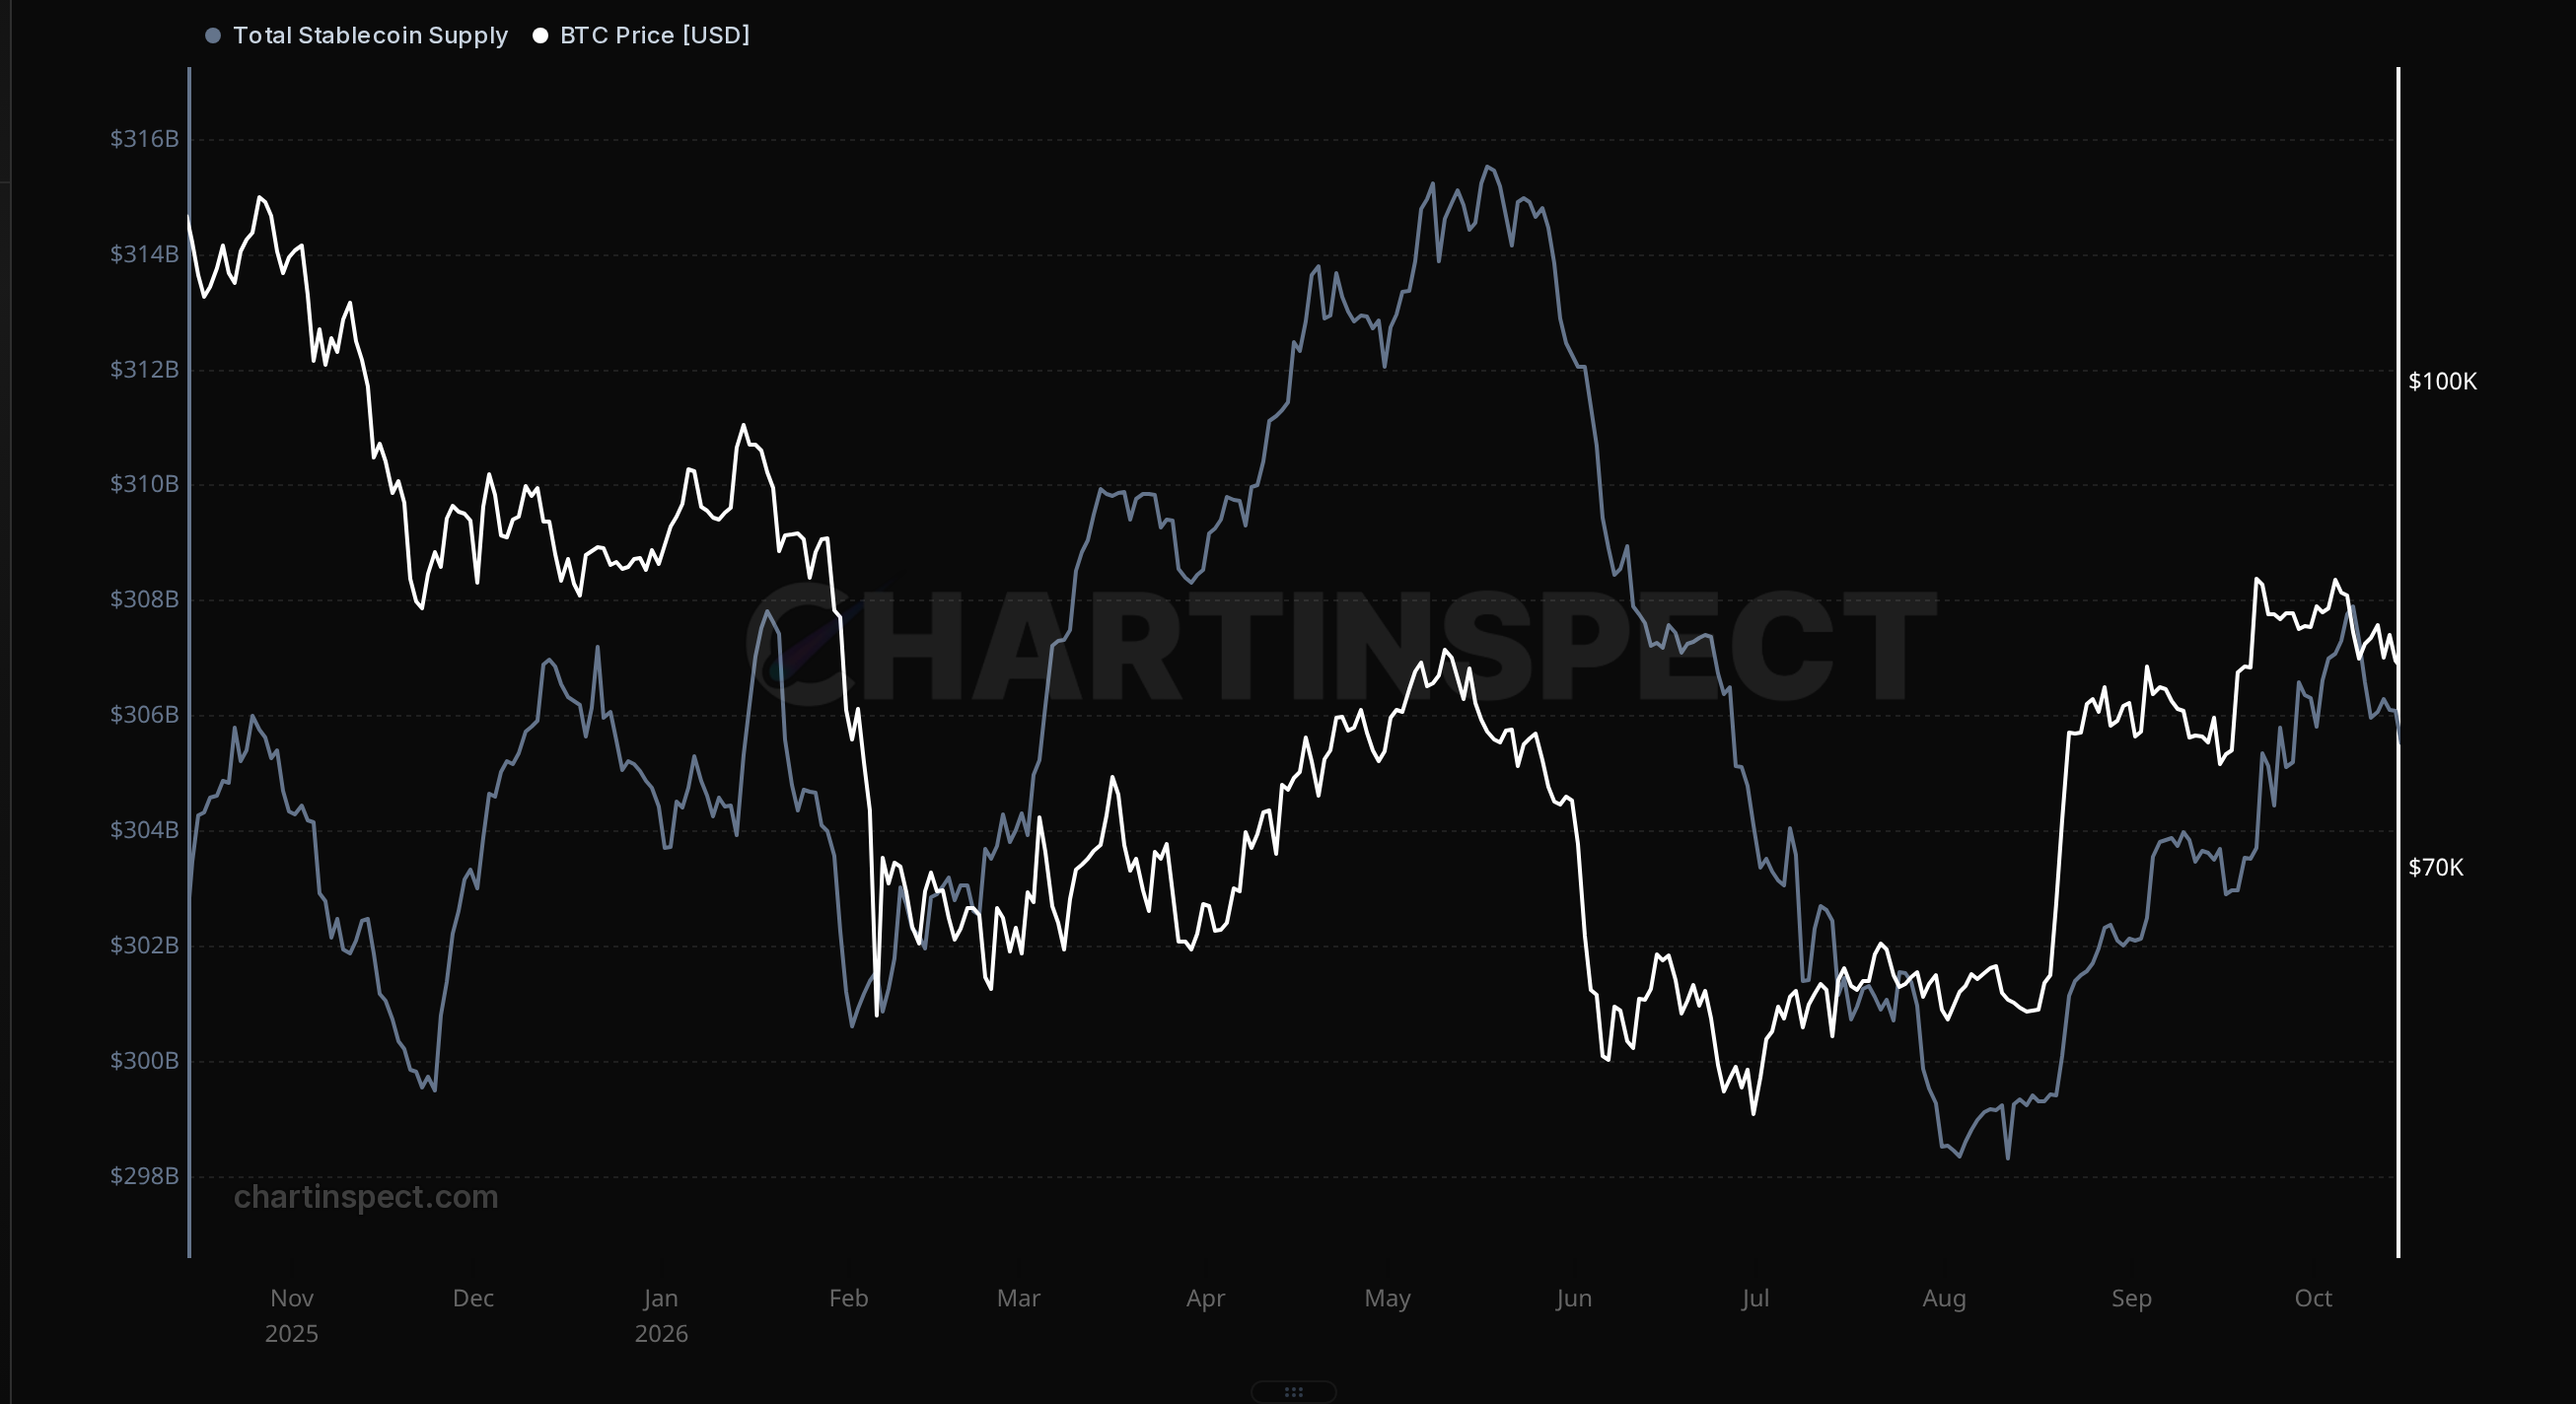
Total stablecoin supply is $305.5B. That's about $10B below the peak of $315.5B set on May 17, up $1.8B over 30 days and down $1.8B over the last week.
Stablecoins are the closest thing crypto has to cash waiting to be spent. One simple way to size it against Bitcoin is the stablecoin supply ratio, Bitcoin's market cap divided by stablecoin supply. It's 5.37: for every $5.37 of Bitcoin there's $1 of stablecoins that could, in principle, buy it.
What I take from it: the buying power is there, but it isn't growing quickly. The sideline money hasn't left, and it hasn't flooded in either. A clear turn higher in stablecoin supply would be one of the better signs that the next leg has fresh fuel behind it, rather than relying on ETFs alone.
Ethereum: more of its holders sit close to the price
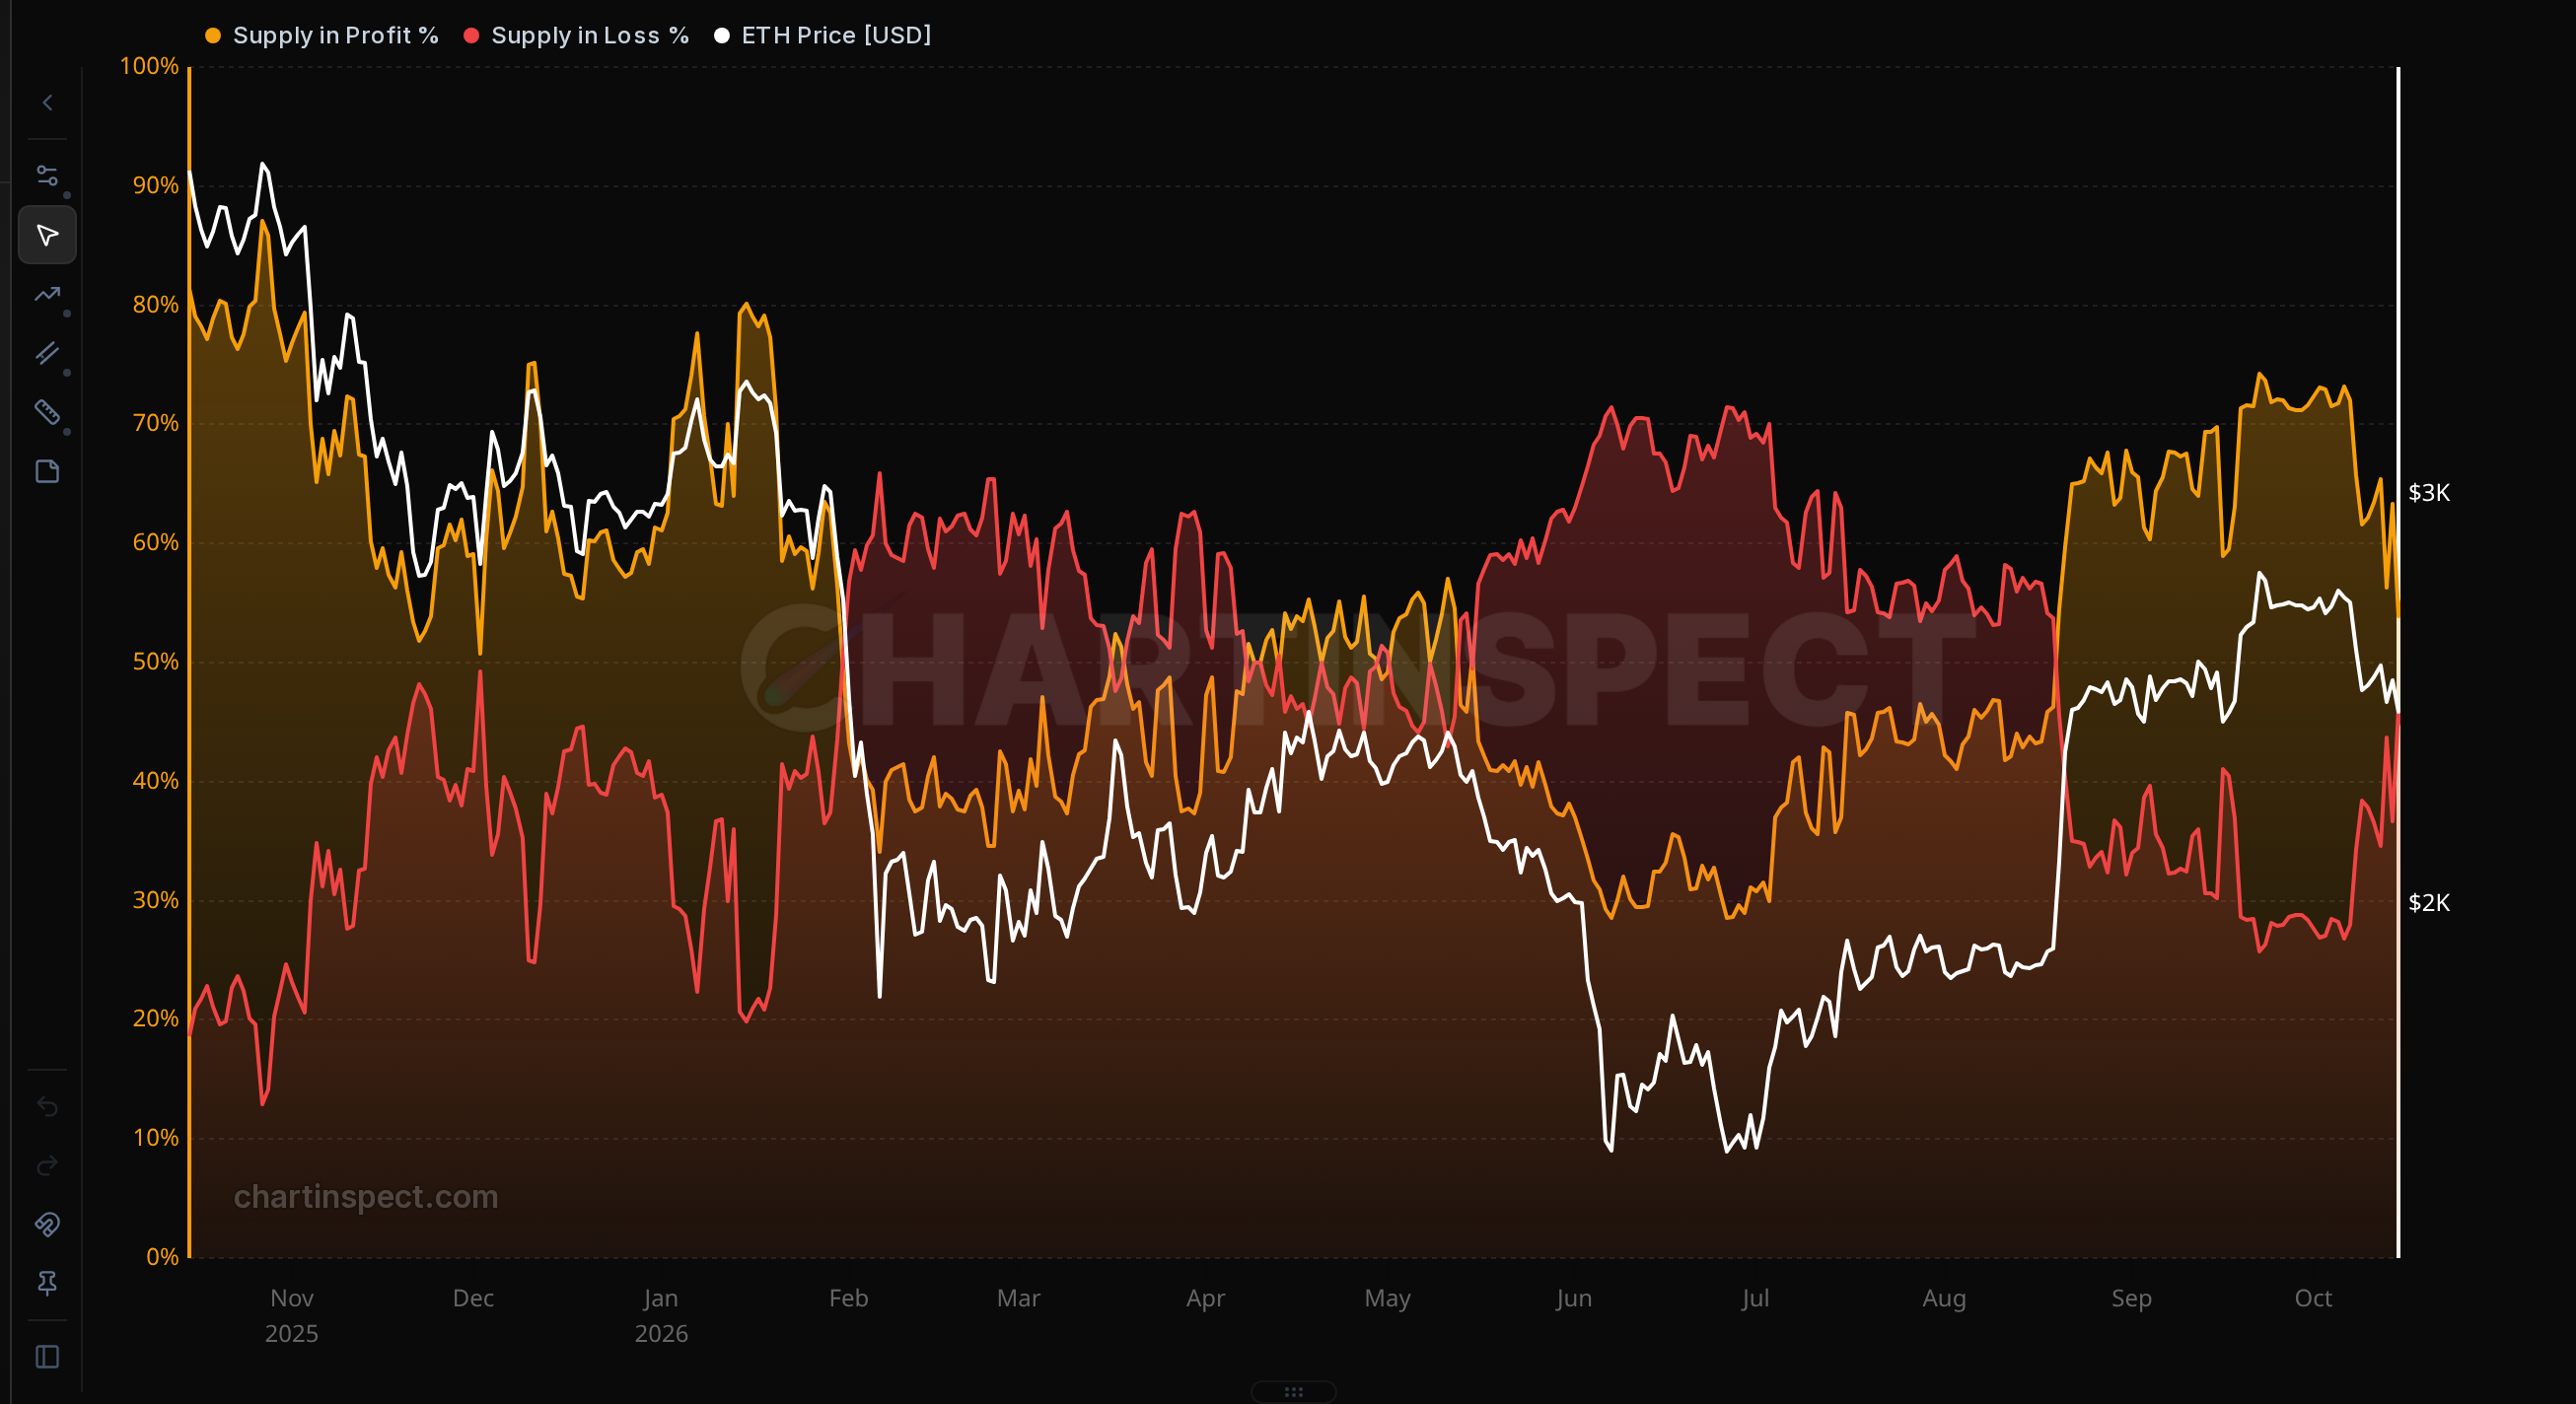
Open Supply in Profit and Loss (set Chain to Ethereum)
Ethereum is about half of my portfolio, so I watch it with the same charts. ETH closed October 15 at $2,440.
The swing in Ethereum holder profitability has been much bigger than in Bitcoin:
| Supply in profit | Jun 30 | Sep 23 | Oct 15 |
|---|---|---|---|
| Ethereum | 30.8% | 71.9% | 56.1% |
| Bitcoin | 76.4% | 68.3% |
A 16-point drop in three weeks tells you a lot of ETH changed hands close to current prices. That cuts both ways. It makes Ethereum more sensitive to small moves, and it means a recovery flips a lot of supply back into profit quickly.
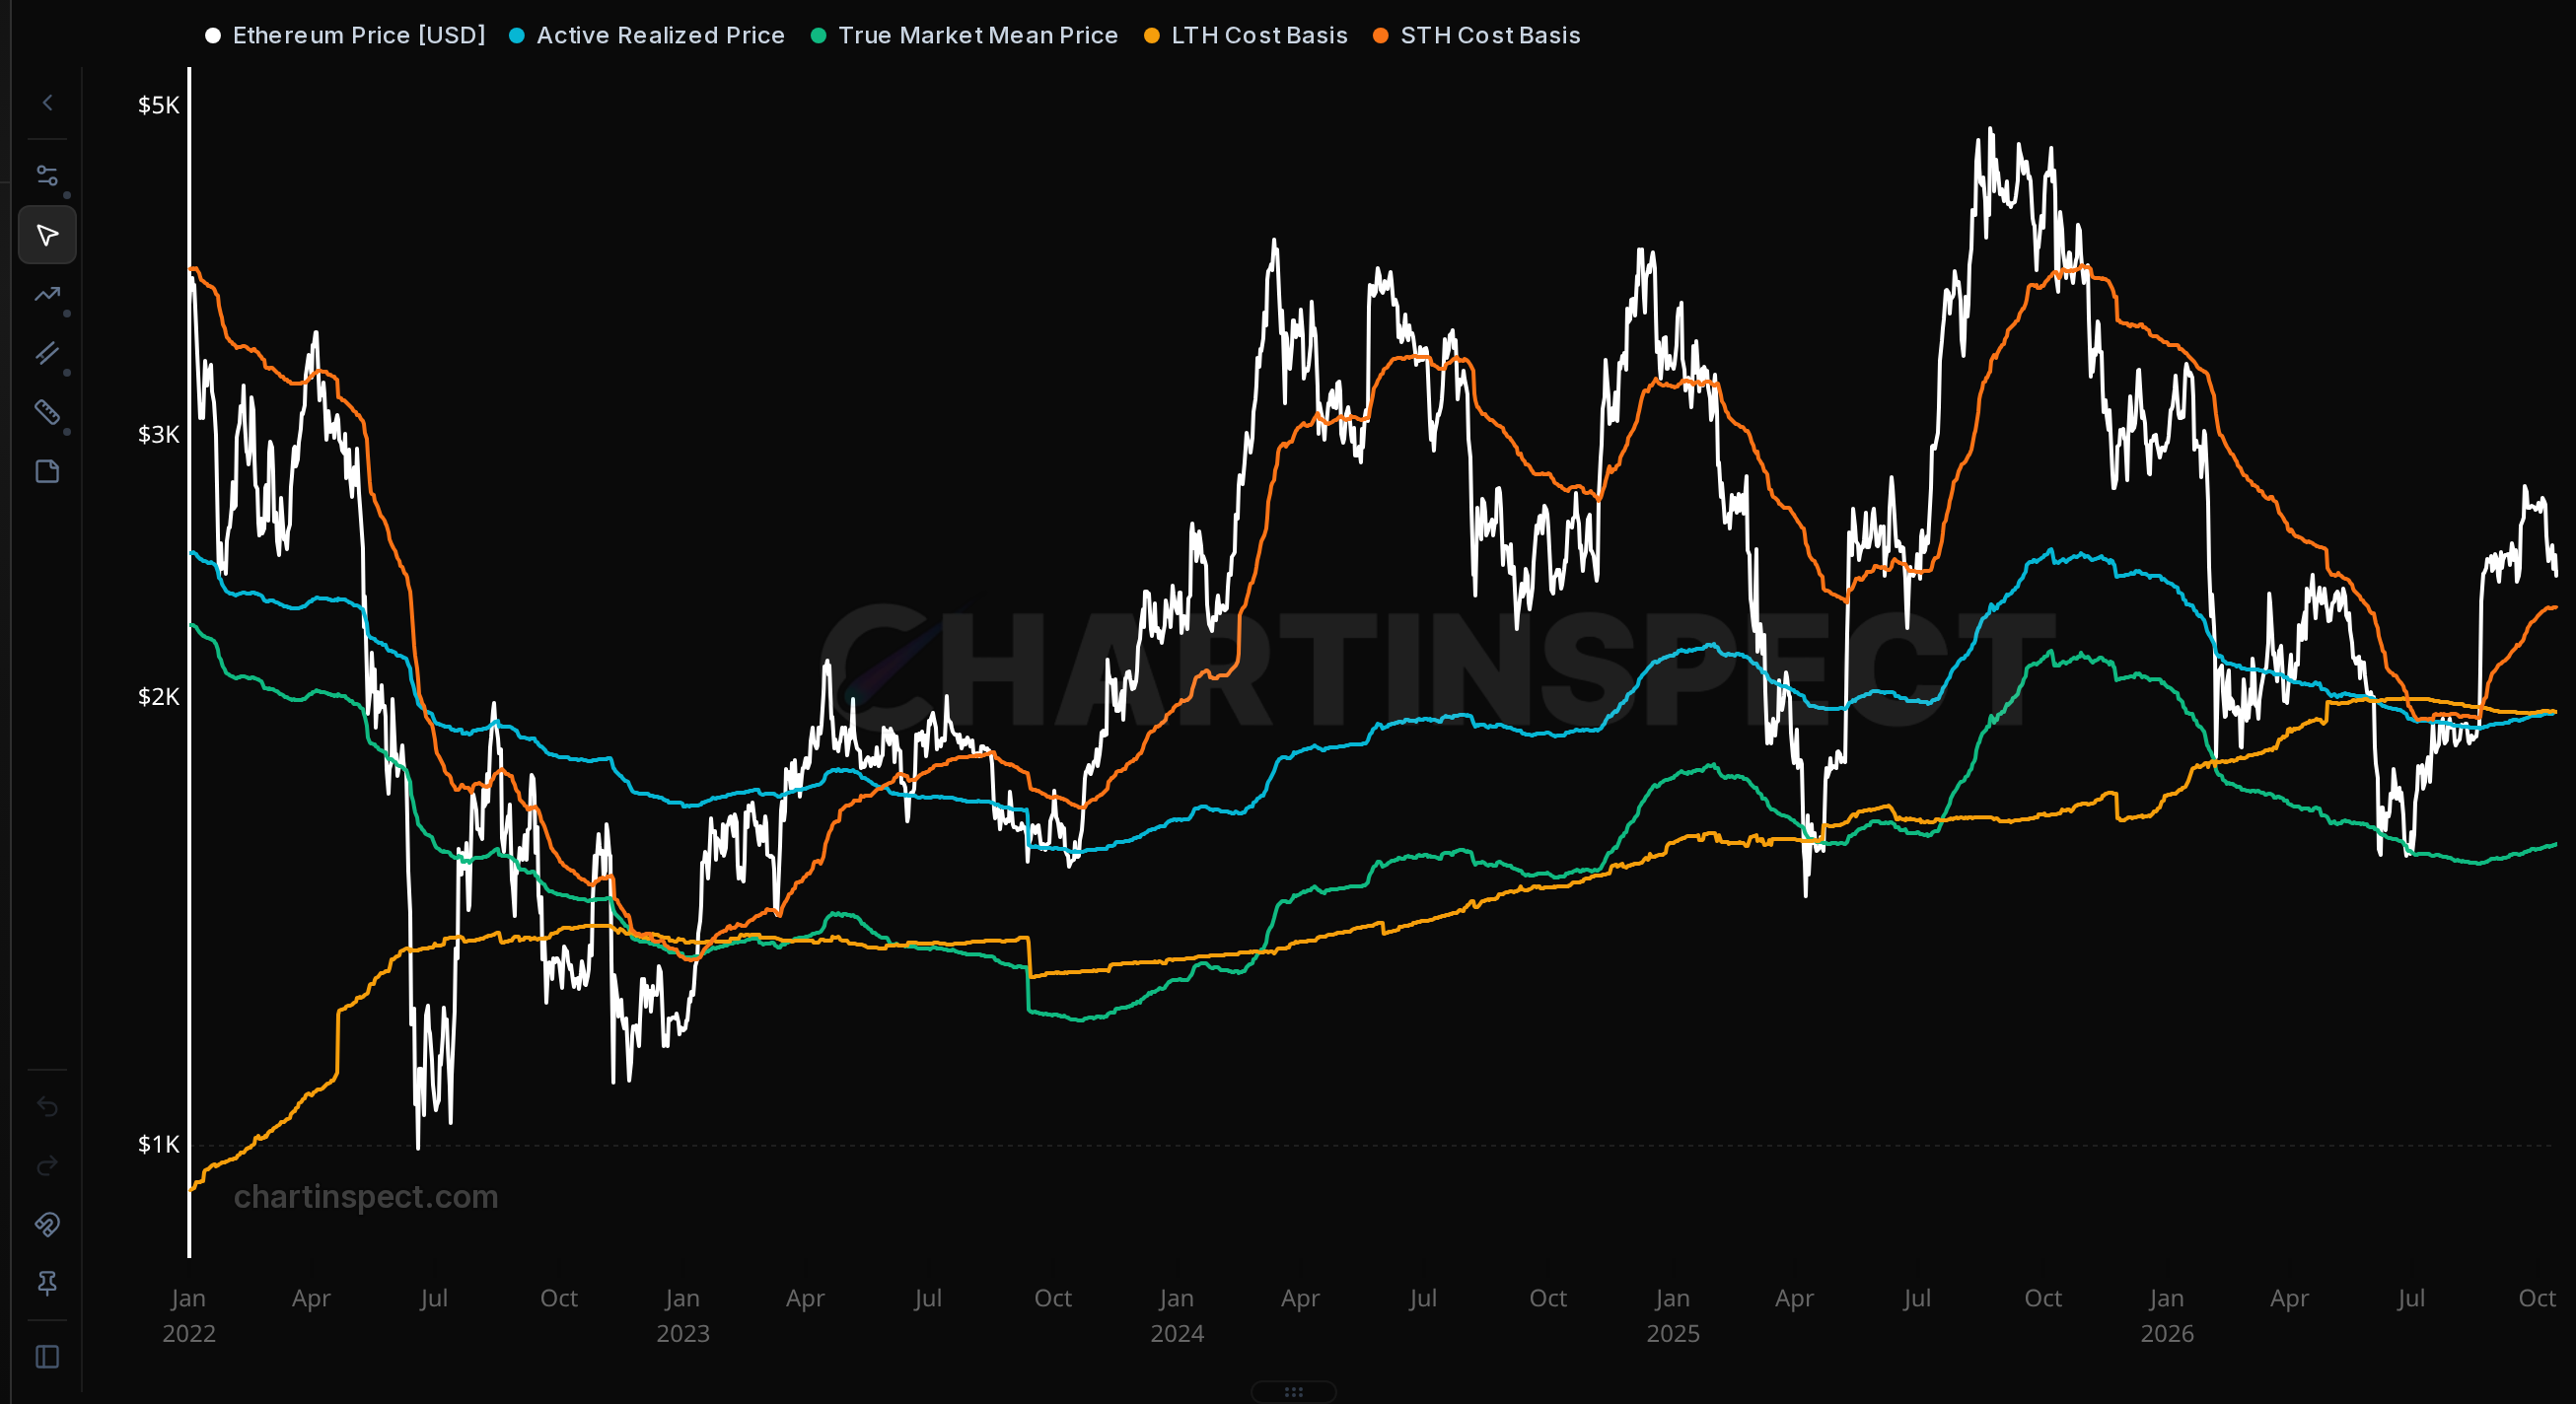
Open Onchain Price Levels (set Chain to Ethereum)
The Ethereum levels are actually in better shape than Bitcoin's. ETH is still above its active realized price (,959), where Bitcoin has slipped below its own. Its short-term holder cost basis is $2,300, about 6% under price, and that line has been rising since August, which means recent buyers have been paying up.
The longer view shows why I watch that line. Through 2023 and early 2024, ETH kept finding support near the short-term holder cost basis. When it broke well below it, as in April 2025 and June 2026, that turned out in hindsight to be a good long-term entry. ETH bottomed near $1,470 in April 2025 and reached about $4,830 by August. It bottomed near $1,570 in June 2026 and closed at $2,440 on October 15.
So I wouldn't treat a drop below $2,300 as only bad news. For a long-term holder, that's where the better buying opportunities have shown up. Below it sits the long-term holder cost basis at $1,958, almost exactly on top of active realized price. That's the zone where the people who've held ETH the longest are back to break-even.
Where the median Ethereum holder sits
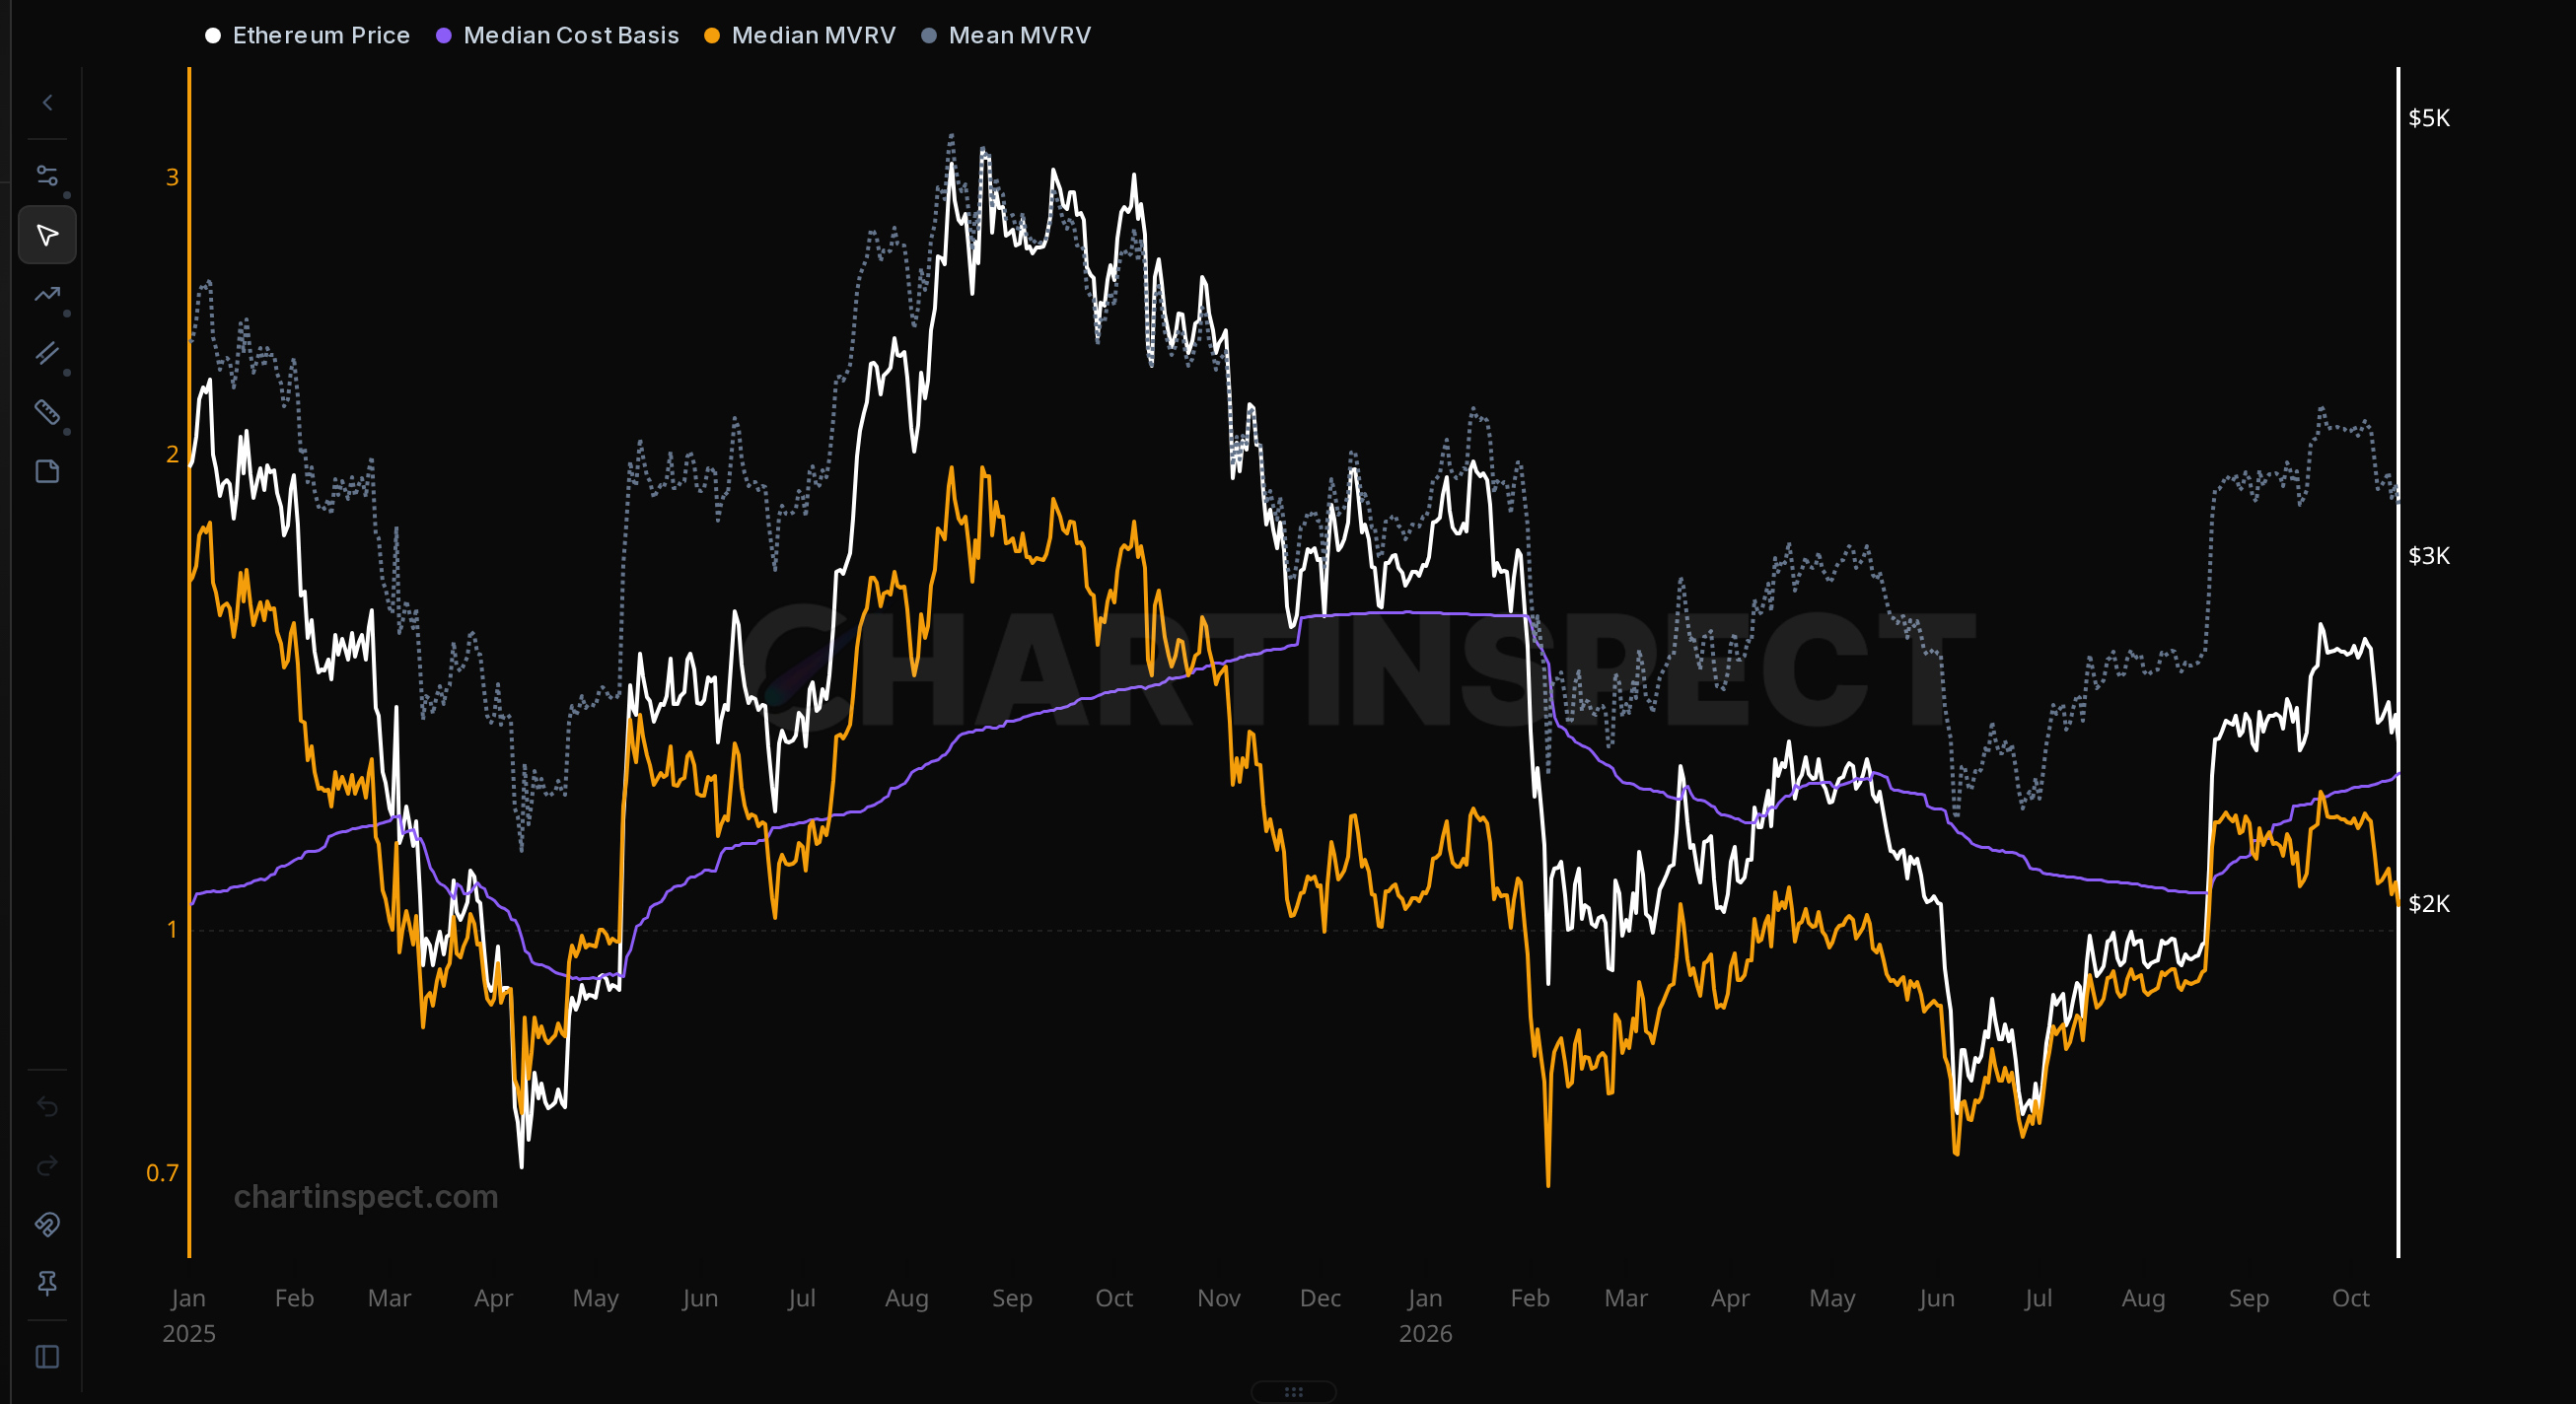
Open Median MVRV (set Chain to Ethereum)
Realized price is the average cost of all ETH, and a handful of very old, very cheap coins drag it down to $1,302. The median cost basis answers a cleaner question: the price below which half of all ETH last moved. Right now that's $2,334.
Median MVRV is price divided by that median. It's 1.05, so ETH sits only about 4% above the point where half of all supply is underwater. Notice that the median cost basis sits just above the short-term holder cost basis. A move below $2,300 would put both recent buyers and the typical ETH holder in loss at the same time.
That's exactly what happened at the recent lows. Median MVRV fell to about 0.77 in April 2025, 0.69 in February 2026 and 0.72 in June 2026. It isn't a precise timing tool: after February, ETH still made a lower low in June. But readings well below 1 have marked periods when most holders were in pain and long-term buyers were getting better prices.
What I'm watching from here
-
Bitcoin's short-term holder cost basis, $74,504. Holding it, or losing it briefly and winning it back, keeps my view the same.
-
Short-term holder realized losses. I want to see them fade as price approaches the cost basis.
-
Open interest. Flat or falling while price stabilizes is good. Rising into a breakdown is the risk.
-
Stablecoin supply. A turn back toward the $315B peak would mean new money is arriving.
-
Ethereum's $2,300 to $2,334 zone, where the short-term holder and median cost basis meet. Below it, I'd look at the $1,958 long-term holder cost basis as the long-term buying zone.
The pressure right now sits with the newest buyers. The holders who own most of the supply aren't panicking. Until that changes, I'm treating this as a shakeout, not a top.
Not financial advice. Do your own research.
Enjoyed this article?
Subscribe to get the latest research in your inbox.
Comments
Sign in to join the discussion.