The Line Bitcoin Can't Lose
North Korea's hackers took $6.3 billion from Binance and Bitcoin fell straight back to the short-term holder line. Here's why I think that retest was normal, where the selling actually came from, and the $66K line I'm watching.

Binance was just hacked for about $6.3 billion, the biggest crypto hack ever. In this week's video I went through what it did to Bitcoin's on-chain data, and in this letter I'll go deeper on the parts I think matter most, and add a few charts that weren't in the video: where the selling actually came from, what stablecoins are doing, a setup that looks a lot like March 2023, and a quick look at Ethereum.
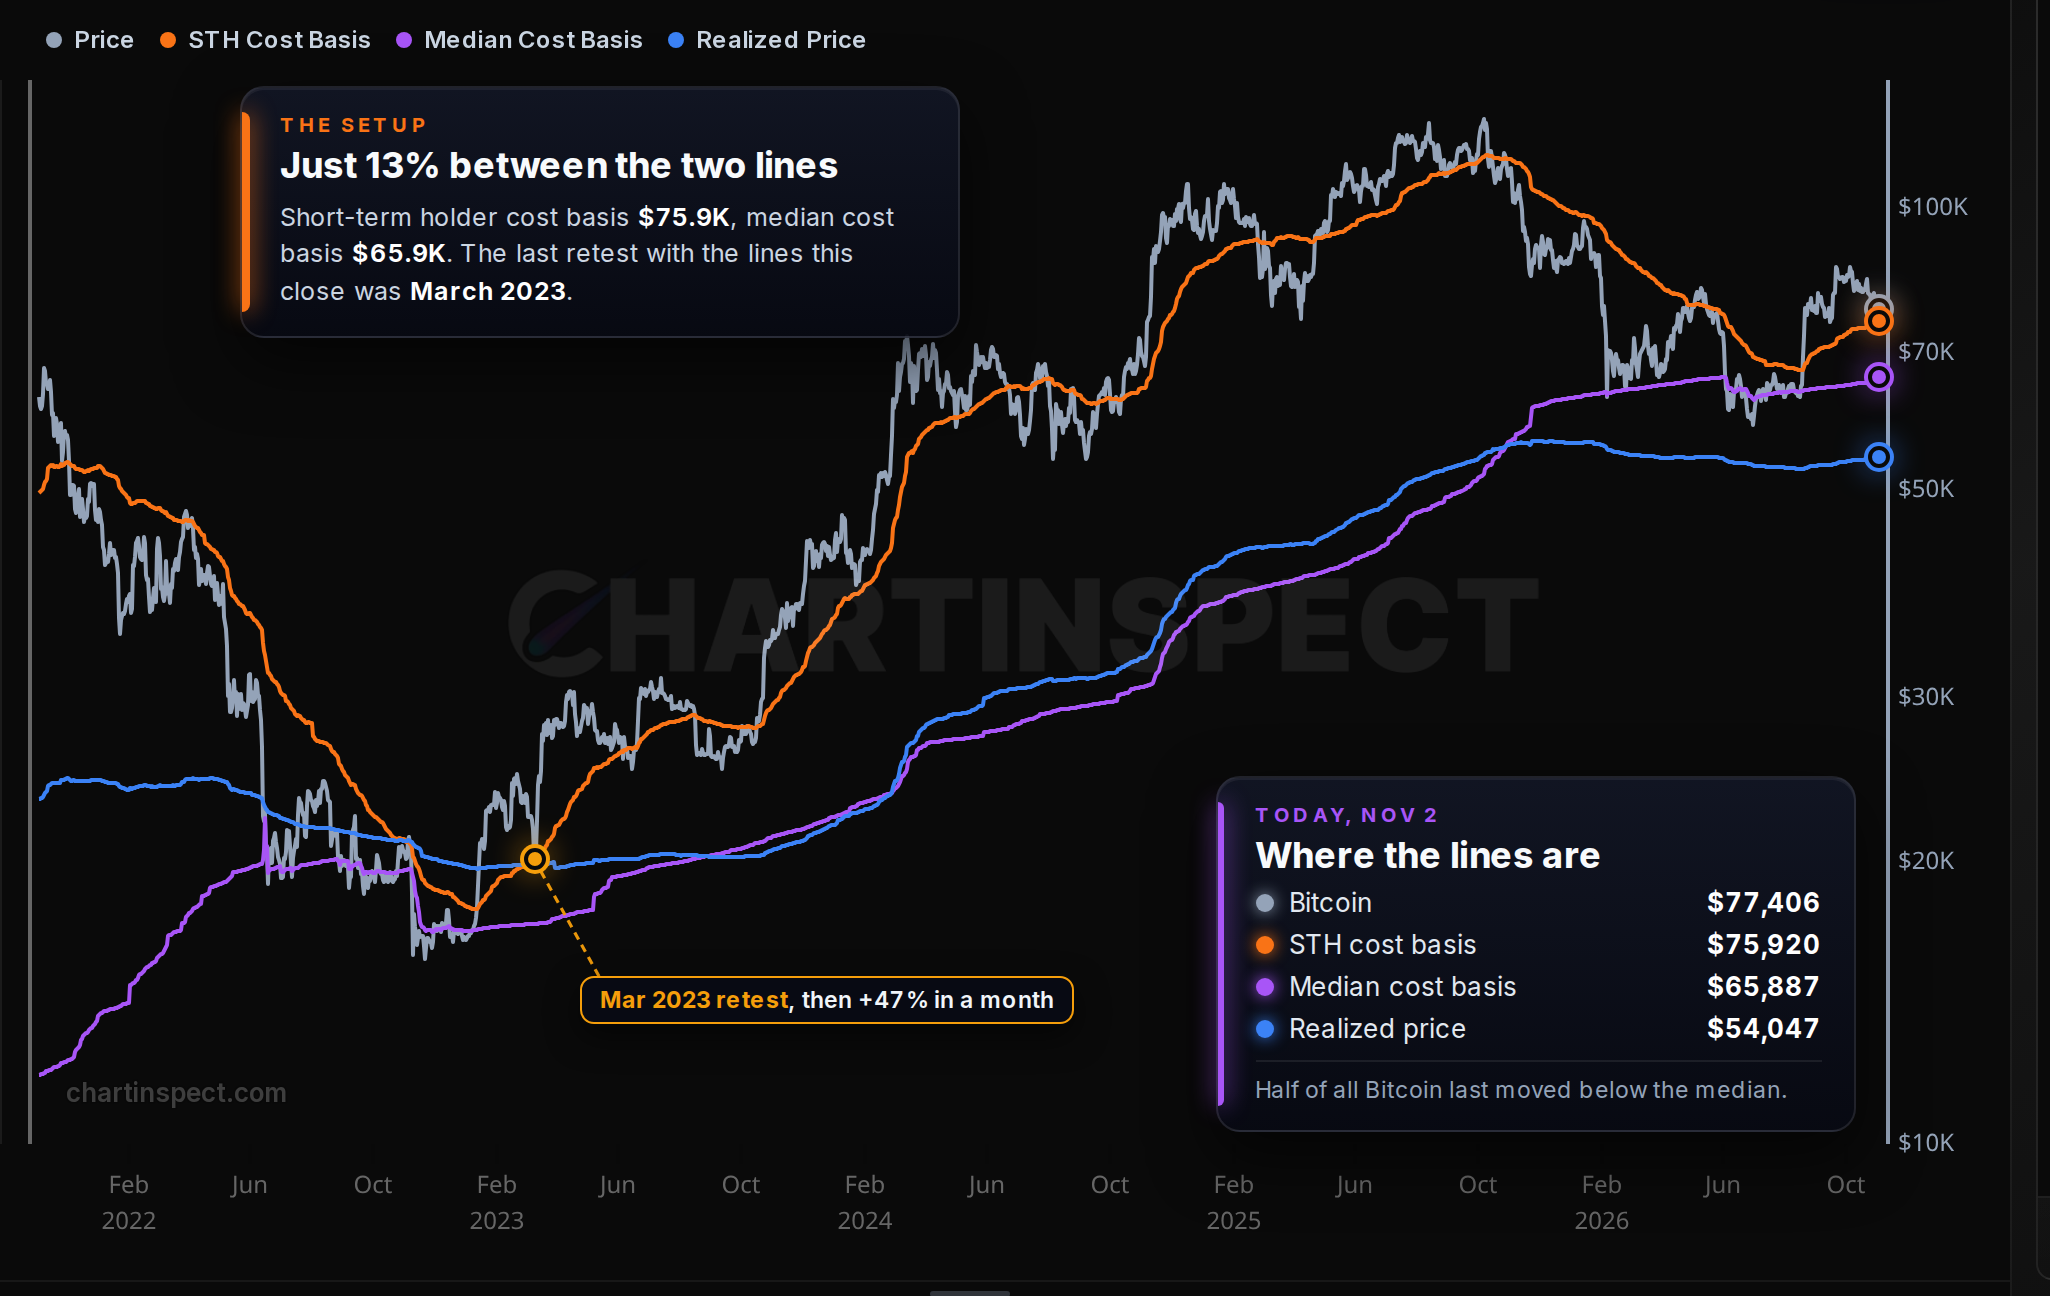
As I write this on November 2, 2026, Bitcoin is at $77,406. The short-term holder cost basis, which is the average price recent buyers paid, is $75,920. The median cost basis, the price half of all Bitcoin last moved below, is $65,887.
The short version
| Level | Price | Why I watch it |
|---|---|---|
| Bitcoin | $77,406 | November 2 |
| Short-term holder cost basis | $75,920 | Recent buyers break even here |
| My strategy's sell level | about $72,100 | A daily close 5% below the line |
| Median cost basis | $65,887 | Half of all Bitcoin last moved below this |
| Realized price | $54,047 | What the average coin last cost |
- The retest was on schedule. Since 2011, every time Bitcoin got back above the short-term holder line and rallied 10% above it, it came back to the line. That's 13 out of 13, and this one took 71 days, which is normal.
- Holders look nervous, not beaten. At the low after the hack, 35% of short-term holder supply was still in profit. At every major low since 2023 it fell below 4%, and in February it hit 0%.
- The line I care most about is about $66K. It's only 13% below the short-term holder line right now. The last time the two were this close was March 2023.
The hack in numbers
On Thursday, October 29, hackers drained Binance hot wallets on about ten blockchains, most of it in about 20 minutes. The FBI says it was North Korea's TraderTraitor group, the same group behind last year's Bybit hack, which was about a quarter of this size. They took about 18,000 BTC, about 200,000 ETH and billions of dollars in stablecoins, and stablecoin issuers have frozen almost $3 billion of it.
Binance says users won't lose money because it's covering the losses itself, from its SAFU emergency fund and its own money, and it says about 95% is already covered. Withdrawals reopened on Sunday, and since then about $3.64 billion has left the exchange, roughly 2.1% of its assets.
To put 18,000 BTC in perspective, US Bitcoin ETFs sold 8,334 BTC on Friday alone. The whole Bitcoin haul is a little over two days of selling like that. In July 2024, the German government sold about 50,000 BTC, almost three times as much, and Bitcoin was back above the short-term holder line within days of the selling finishing.
The retest was on schedule
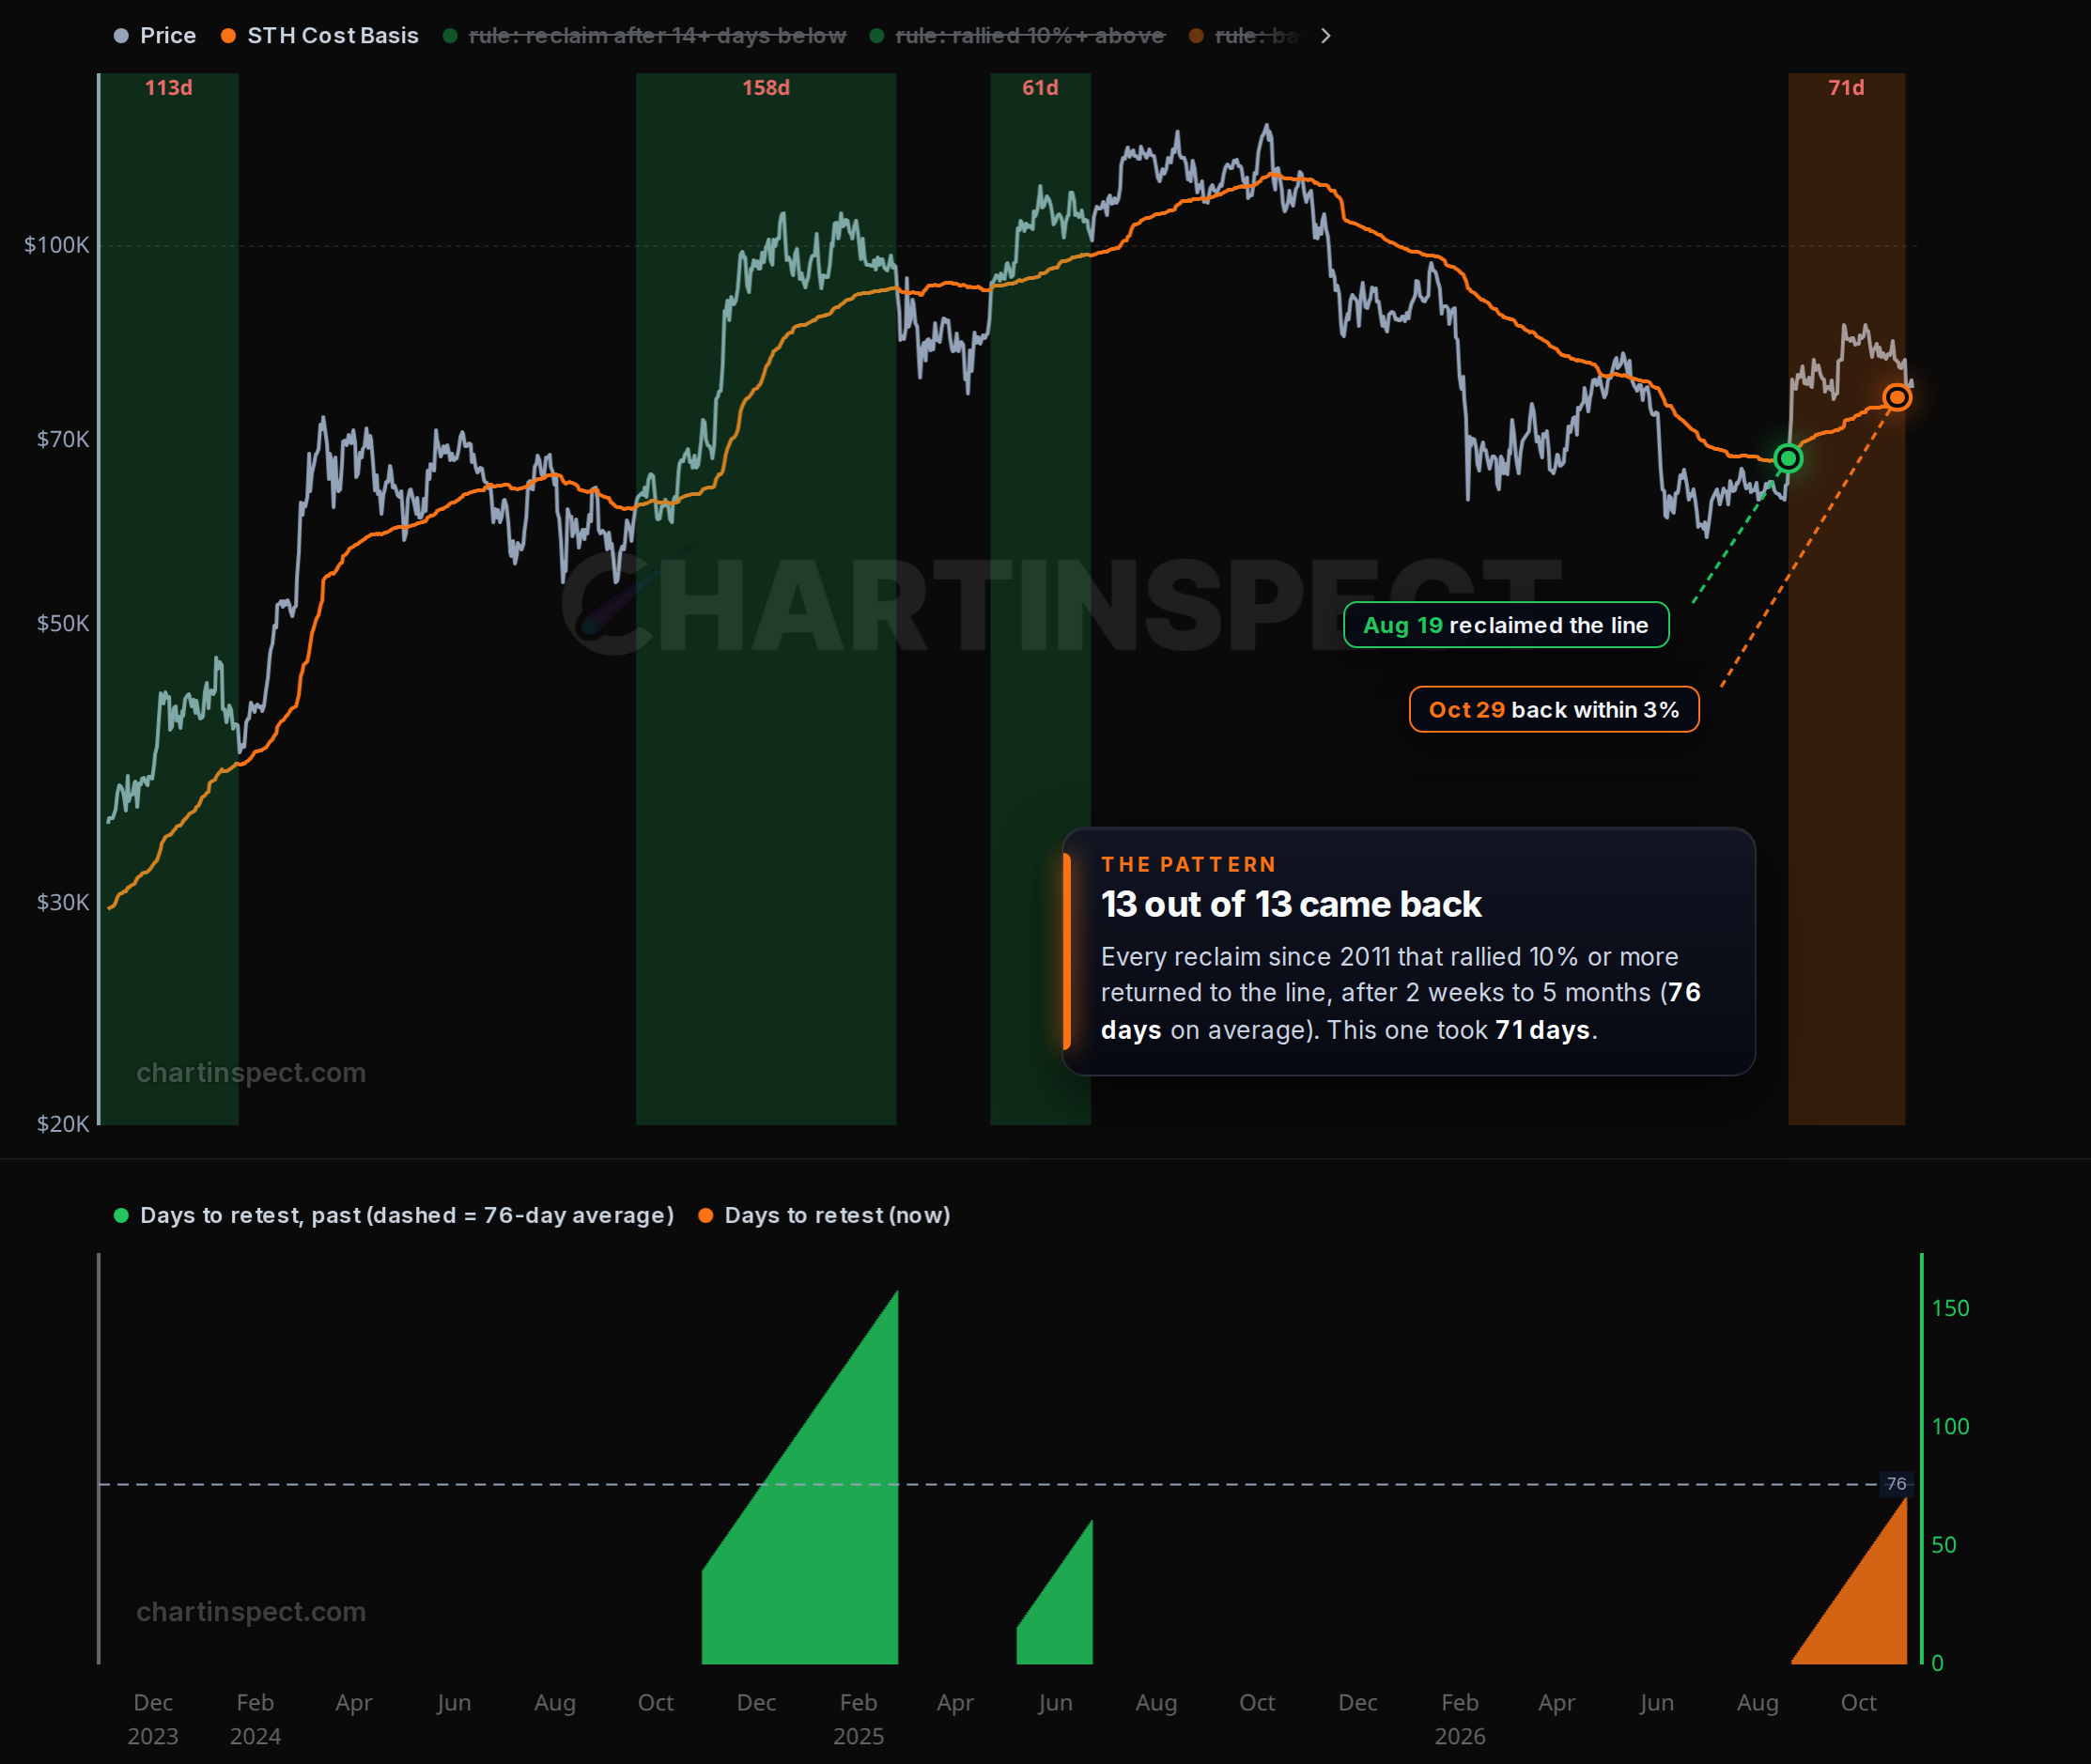
Here's the rule I tested. A reclaim is when Bitcoin closes back above the short-term holder line after at least 14 days below it. If it then rallies at least 10% above the line, I count how many days until it comes back within 3% of it.
Since 2011 that has happened 13 times, and all 13 came back. It took anywhere from two weeks to five months, with a median of 57 days and an average of about 76. This one reclaimed the line on August 19 and came back on October 29, 71 days later. The hack probably sped up the last few days, but the retest itself was always likely.
What happened after the dips is the part I find most useful. In the last bull market, Bitcoin fell about 10% or more below this line five times:
| The low | Below the line | Price at the low | 3 months later |
|---|---|---|---|
| September 11, 2023 | 9.9% | $25,179 | +64% |
| July 7, 2024 | 13.1% | $55,919 | +12% |
| August 5, 2024 | 16.7% | $54,026 | +26% |
| September 6, 2024 | 13.1% | $53,998 | +85% |
| April 8, 2025 | 18.2% | $76,270 | +43% |
Every one of them was higher three months later. The one time that failed was the break in November 2025, when the bull market was over: Bitcoin went from $85,144 to $68,016 in the next three months. So I don't see a retest on its own as bearish.
Are holders panicking?
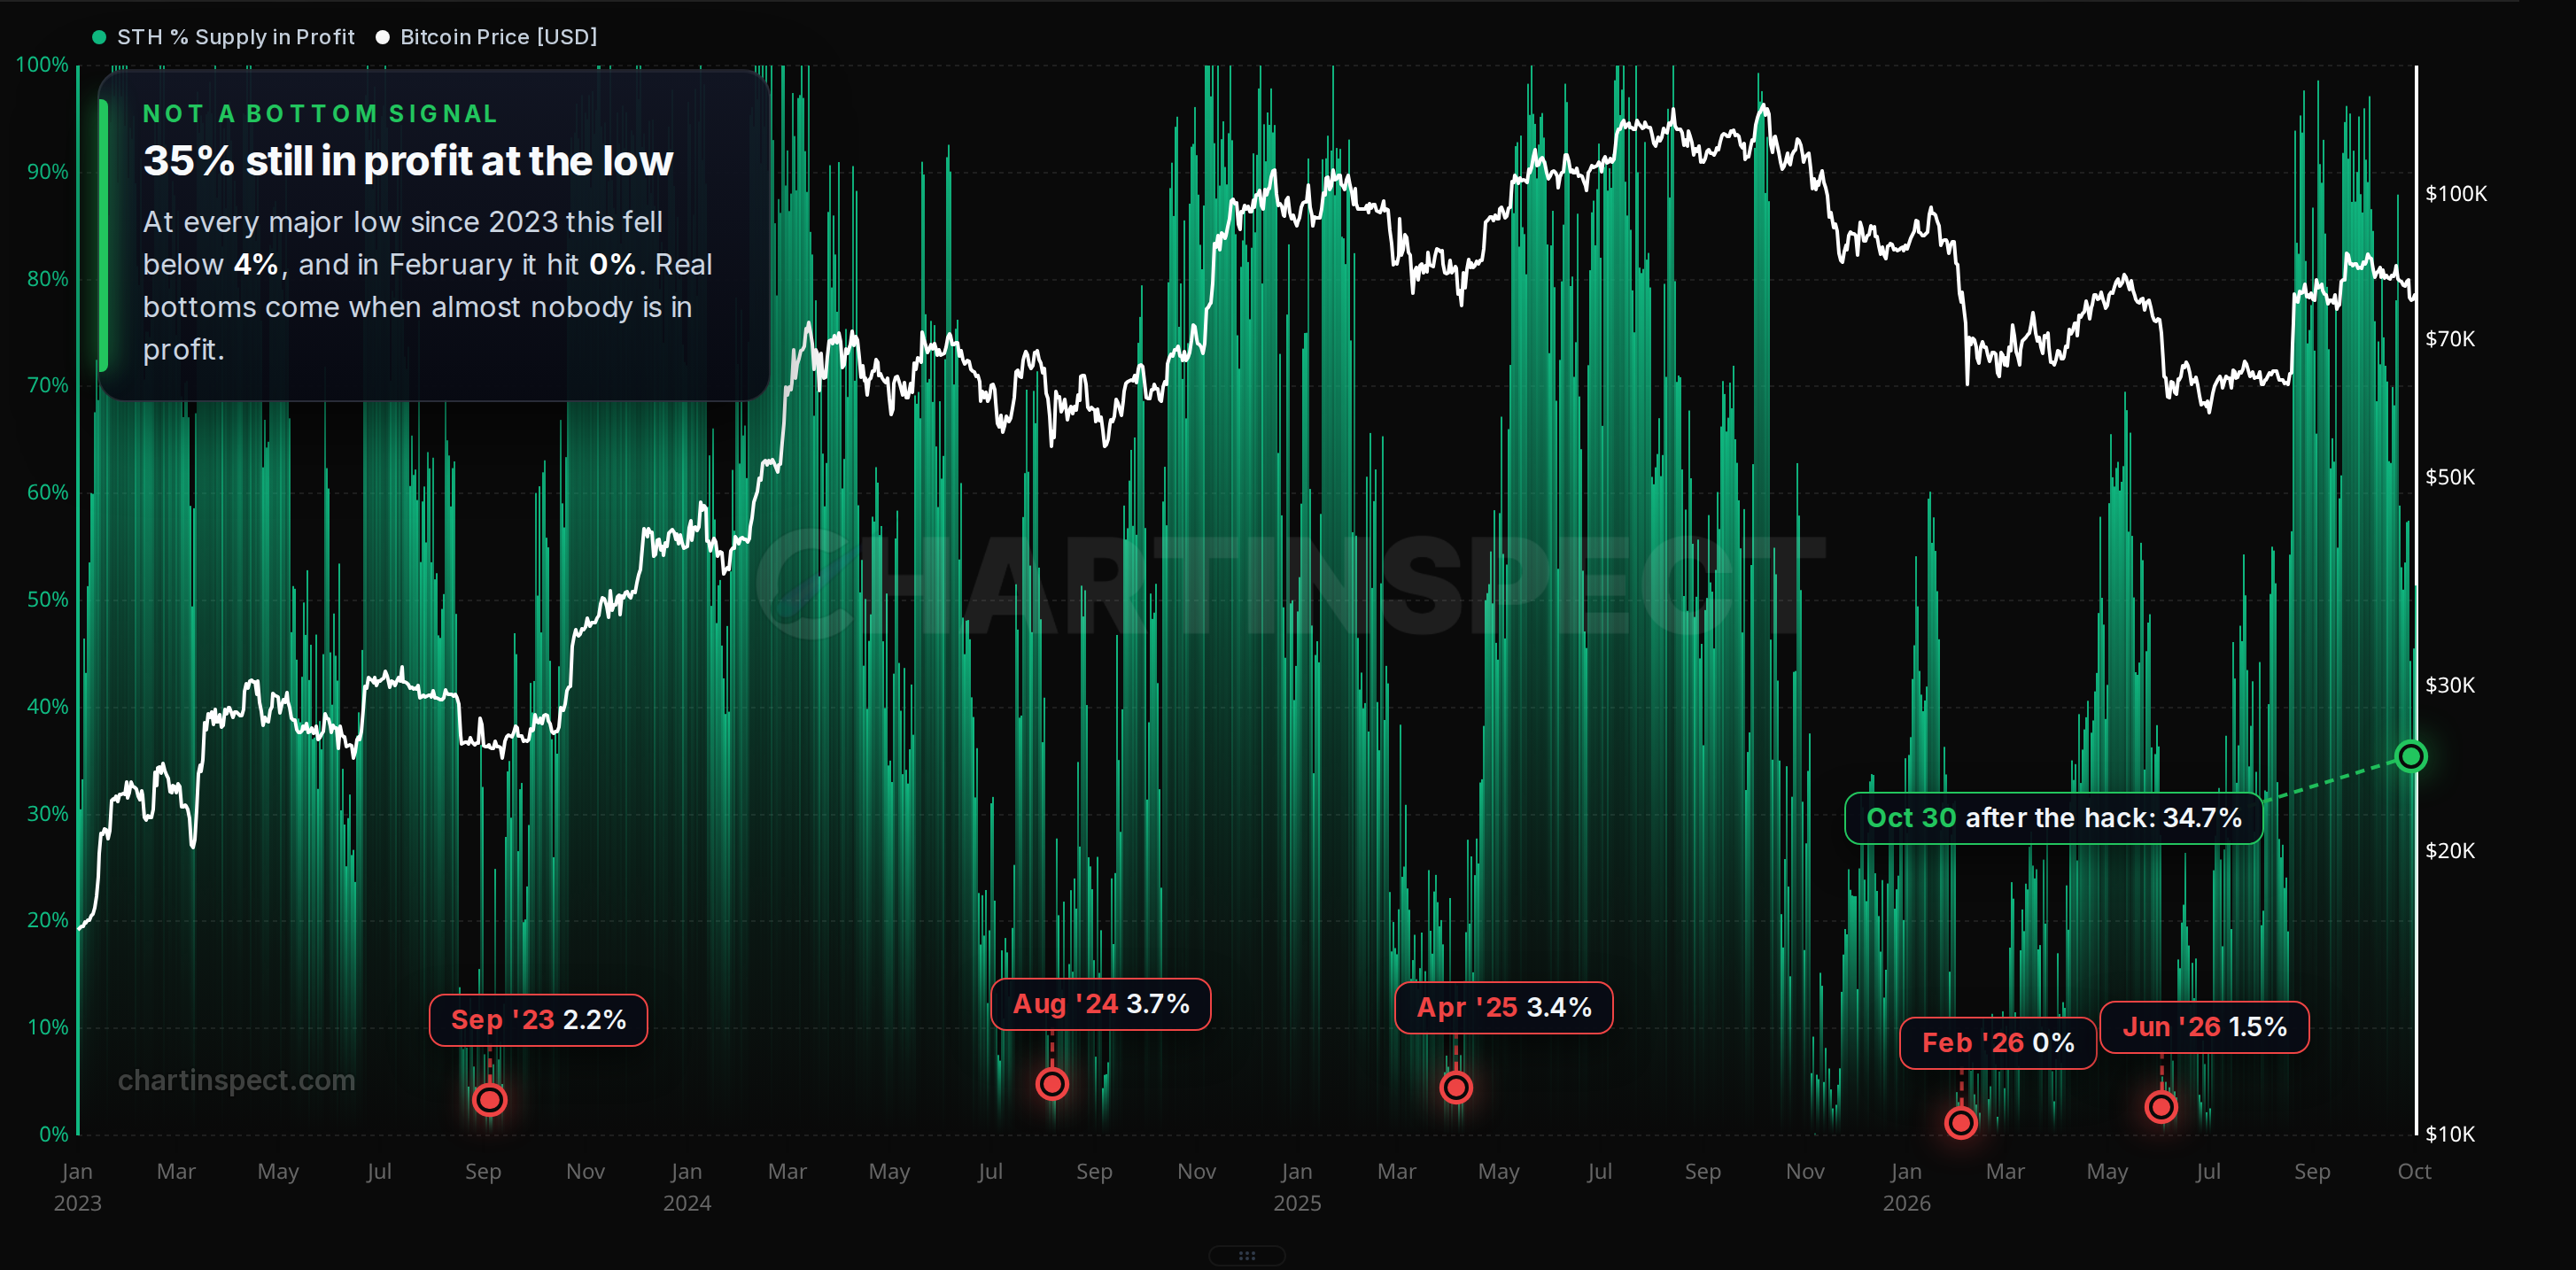
This chart shows how much of the supply held by recent buyers is in profit. At real bottoms, almost nobody is, and that's usually when the last weak hands sell.
| Date | Short-term holder supply in profit |
|---|---|
| September 5, 2023 | 2.2% |
| August 7, 2024 | 3.7% |
| April 6, 2025 | 3.4% |
| February 3, 2026 | 0% |
| June 3, 2026 | 1.5% |
| October 30, 2026 (after the hack) | 34.7% |
| November 1, 2026 | 51.4% |
It only got down to about 35% this time. It was back above 50% by Sunday, and it's around 40% today after another small dip.
Realized losses tell the same story. These are coins sold for less than they cost, added up for each day:
| Day | Realized losses |
|---|---|
| February 5, 2026 | $7.15 billion |
| April 17, 2025 | $2.37 billion |
| June 2, 2026 | $2.22 billion |
| October 30, 2026 (day after the hack) | $867 million |
| October 29, 2026 (hack day) | $819 million |
The worst day this week was about an eighth of the February capitulation.
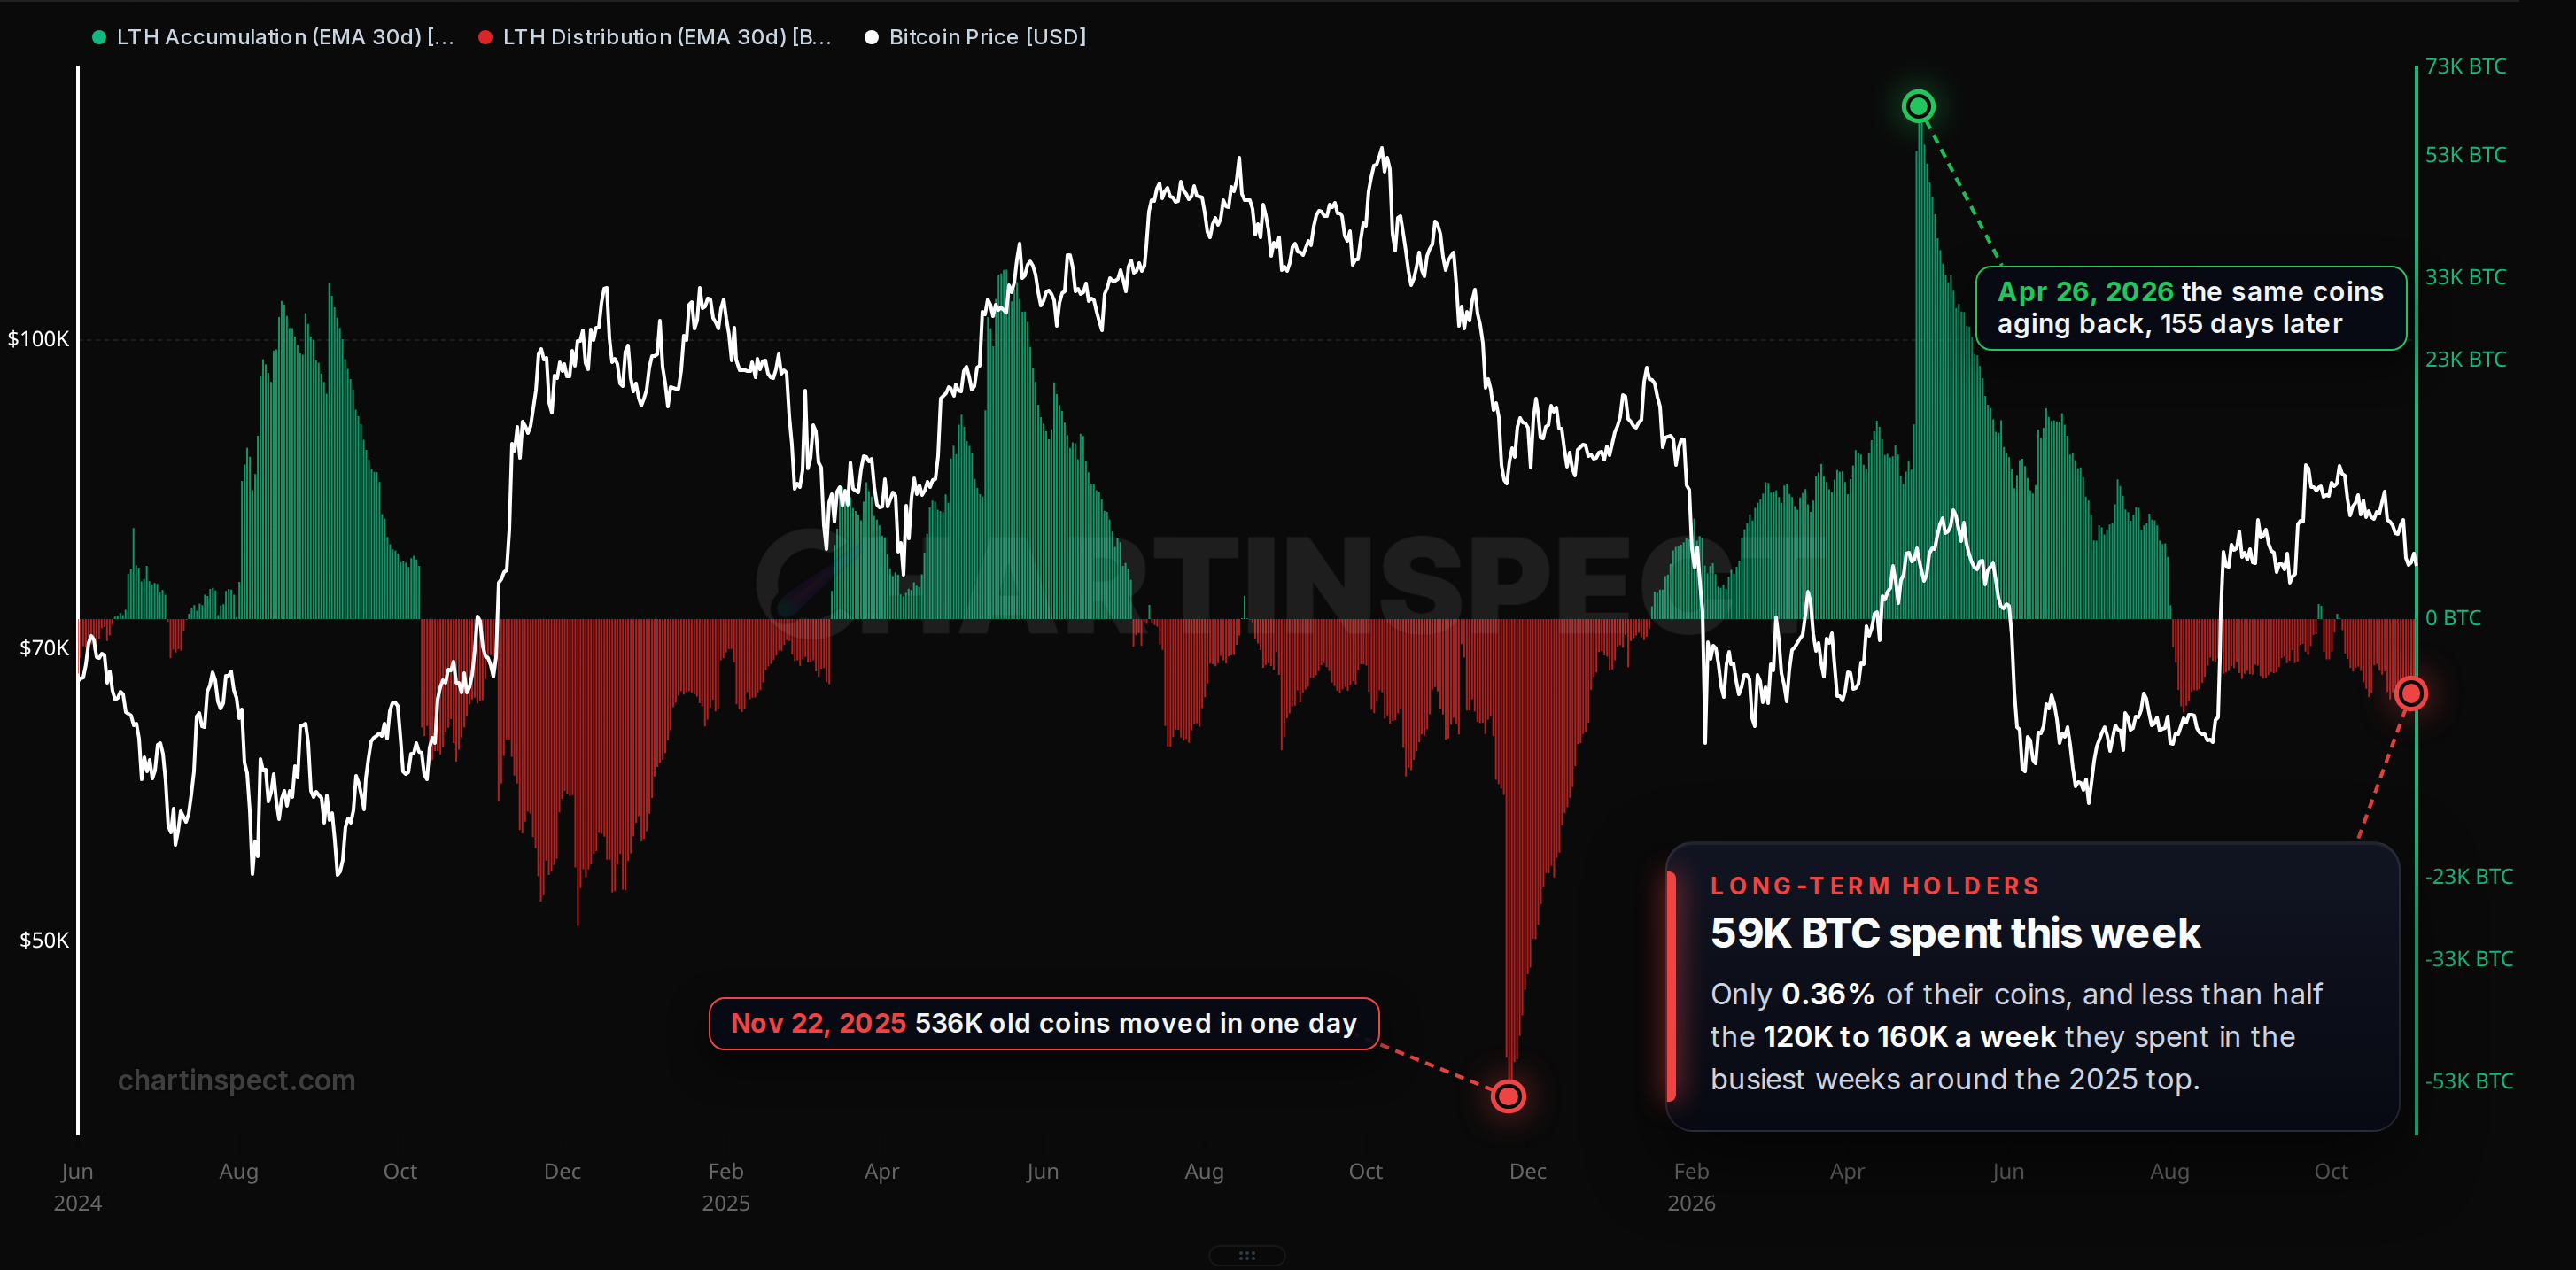
Long-term holders did sell into the drop. From October 26 to November 1 they spent about 59,000 BTC, which is 0.36% of the 16.3 million they hold. In the busiest weeks around the 2025 top they were spending 120,000 to 160,000 BTC a week, so this is less than half of that pace. To me this looks like people getting nervous, not people giving up.
One thing to know when you read this chart. The huge red drop in late 2025 is mostly a single day, November 22, when about 536,000 old coins moved. Exactly 155 days later, which is the cutoff for a long-term holder, a similar amount (598,000) aged back in. That's the big green spike in April. It looks like one large holder moving its own wallets, not real selling, so I left it out of the comparison above.
Where the selling came from (this wasn't in the video)
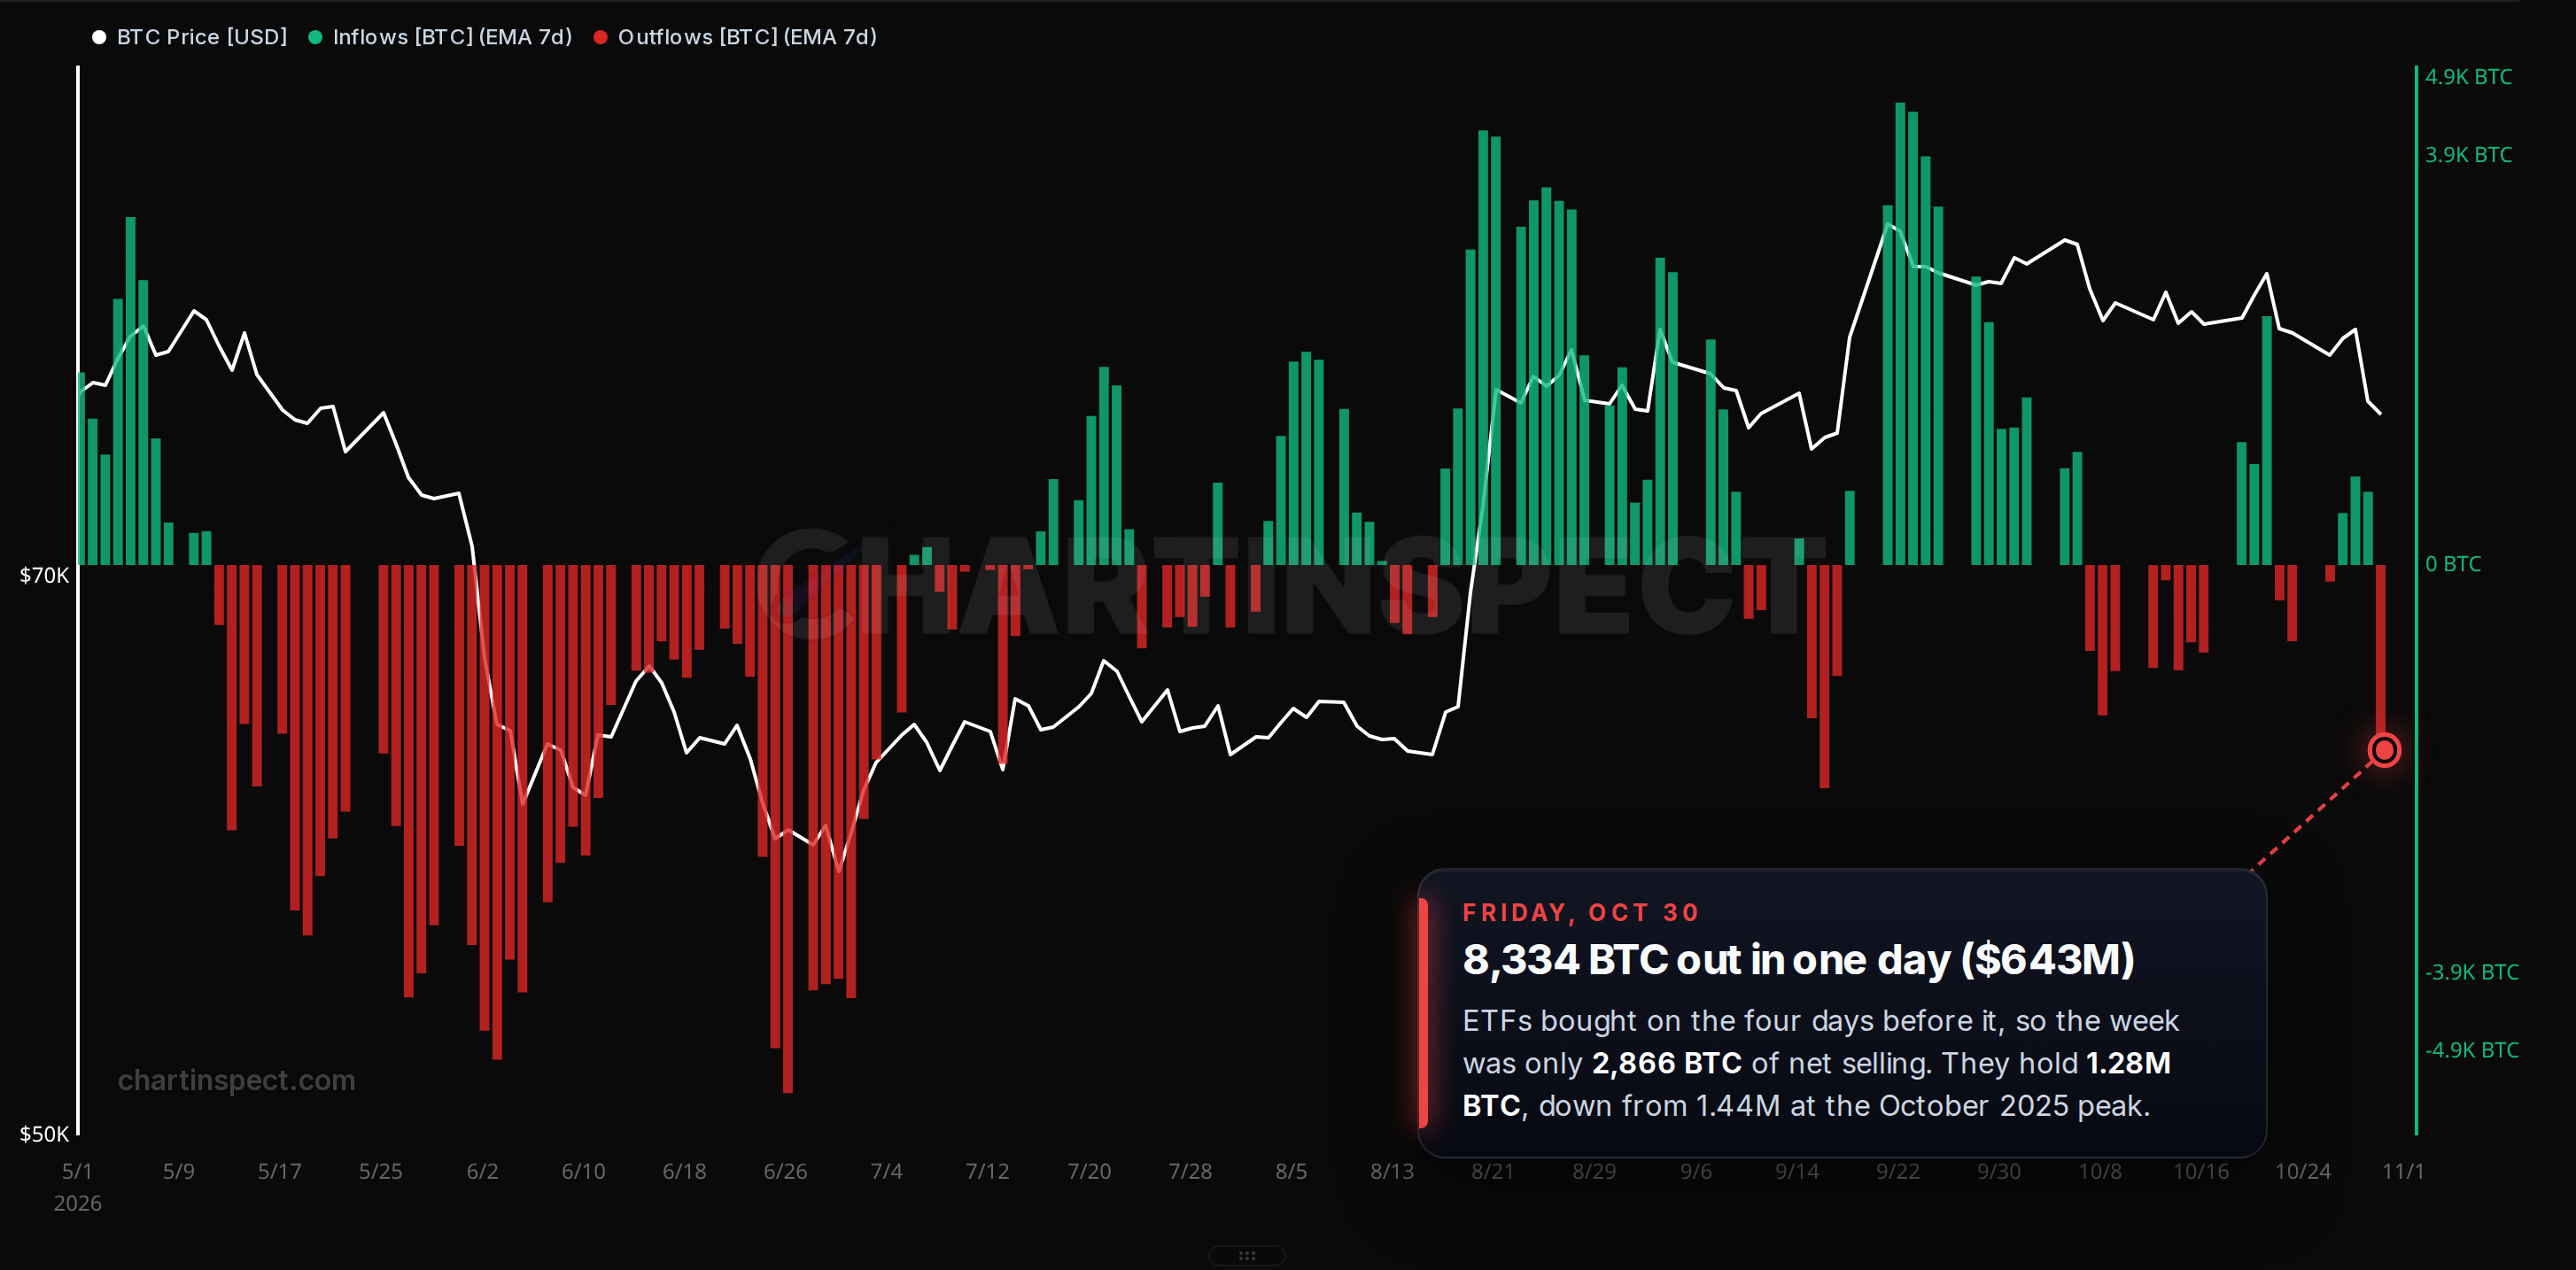
Open Bitcoin ETF Inflows and Outflows
ETFs. Friday's outflow was 8,334 BTC, about $643 million. That's big, but not unusual. ETFs had taken in Bitcoin on each of the four days before it, so the whole week was only 2,866 BTC of net selling, and October as a whole was 7,018 BTC out. The bigger picture is slower. As of Friday, US spot ETFs held 1.28 million BTC, down from 1.44 million at their peak on October 12, 2025.
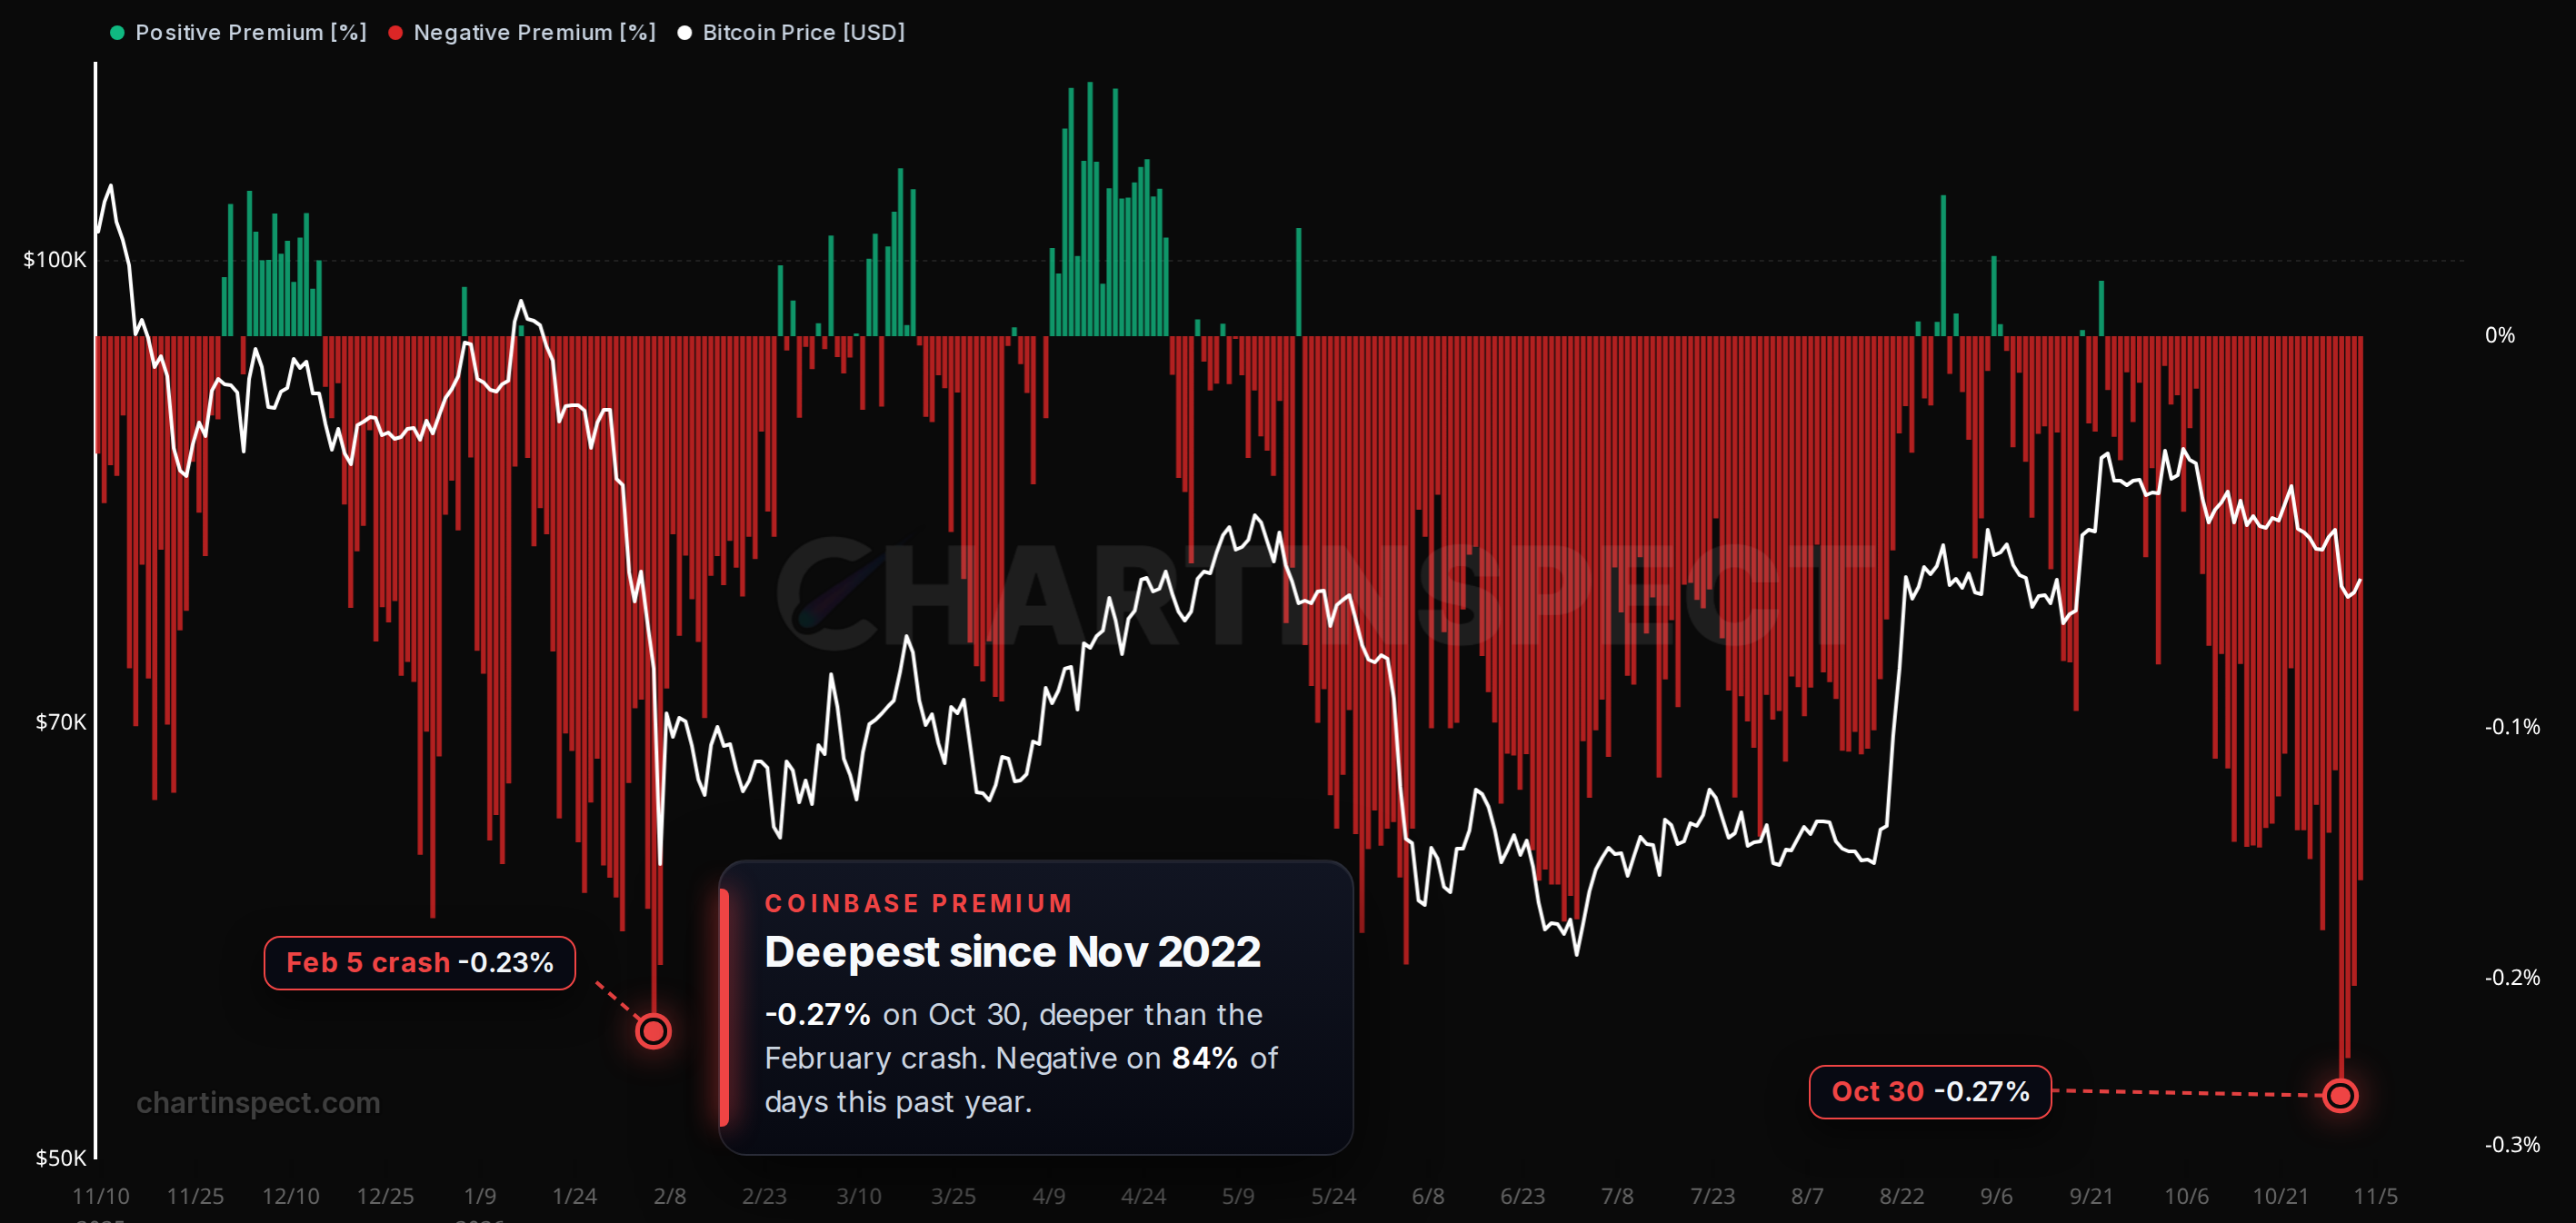
Coinbase. The Coinbase premium compares Bitcoin's price on Coinbase, where a lot of US money trades, with the price everywhere else. On October 30 it hit -0.27%, the deepest discount since November 2022, and it's still -0.16% today. It has been negative on 84% of days over the past year. Together with the ETF outflows, that tells me most of the selling around the hack came from US investors, not from offshore traders.
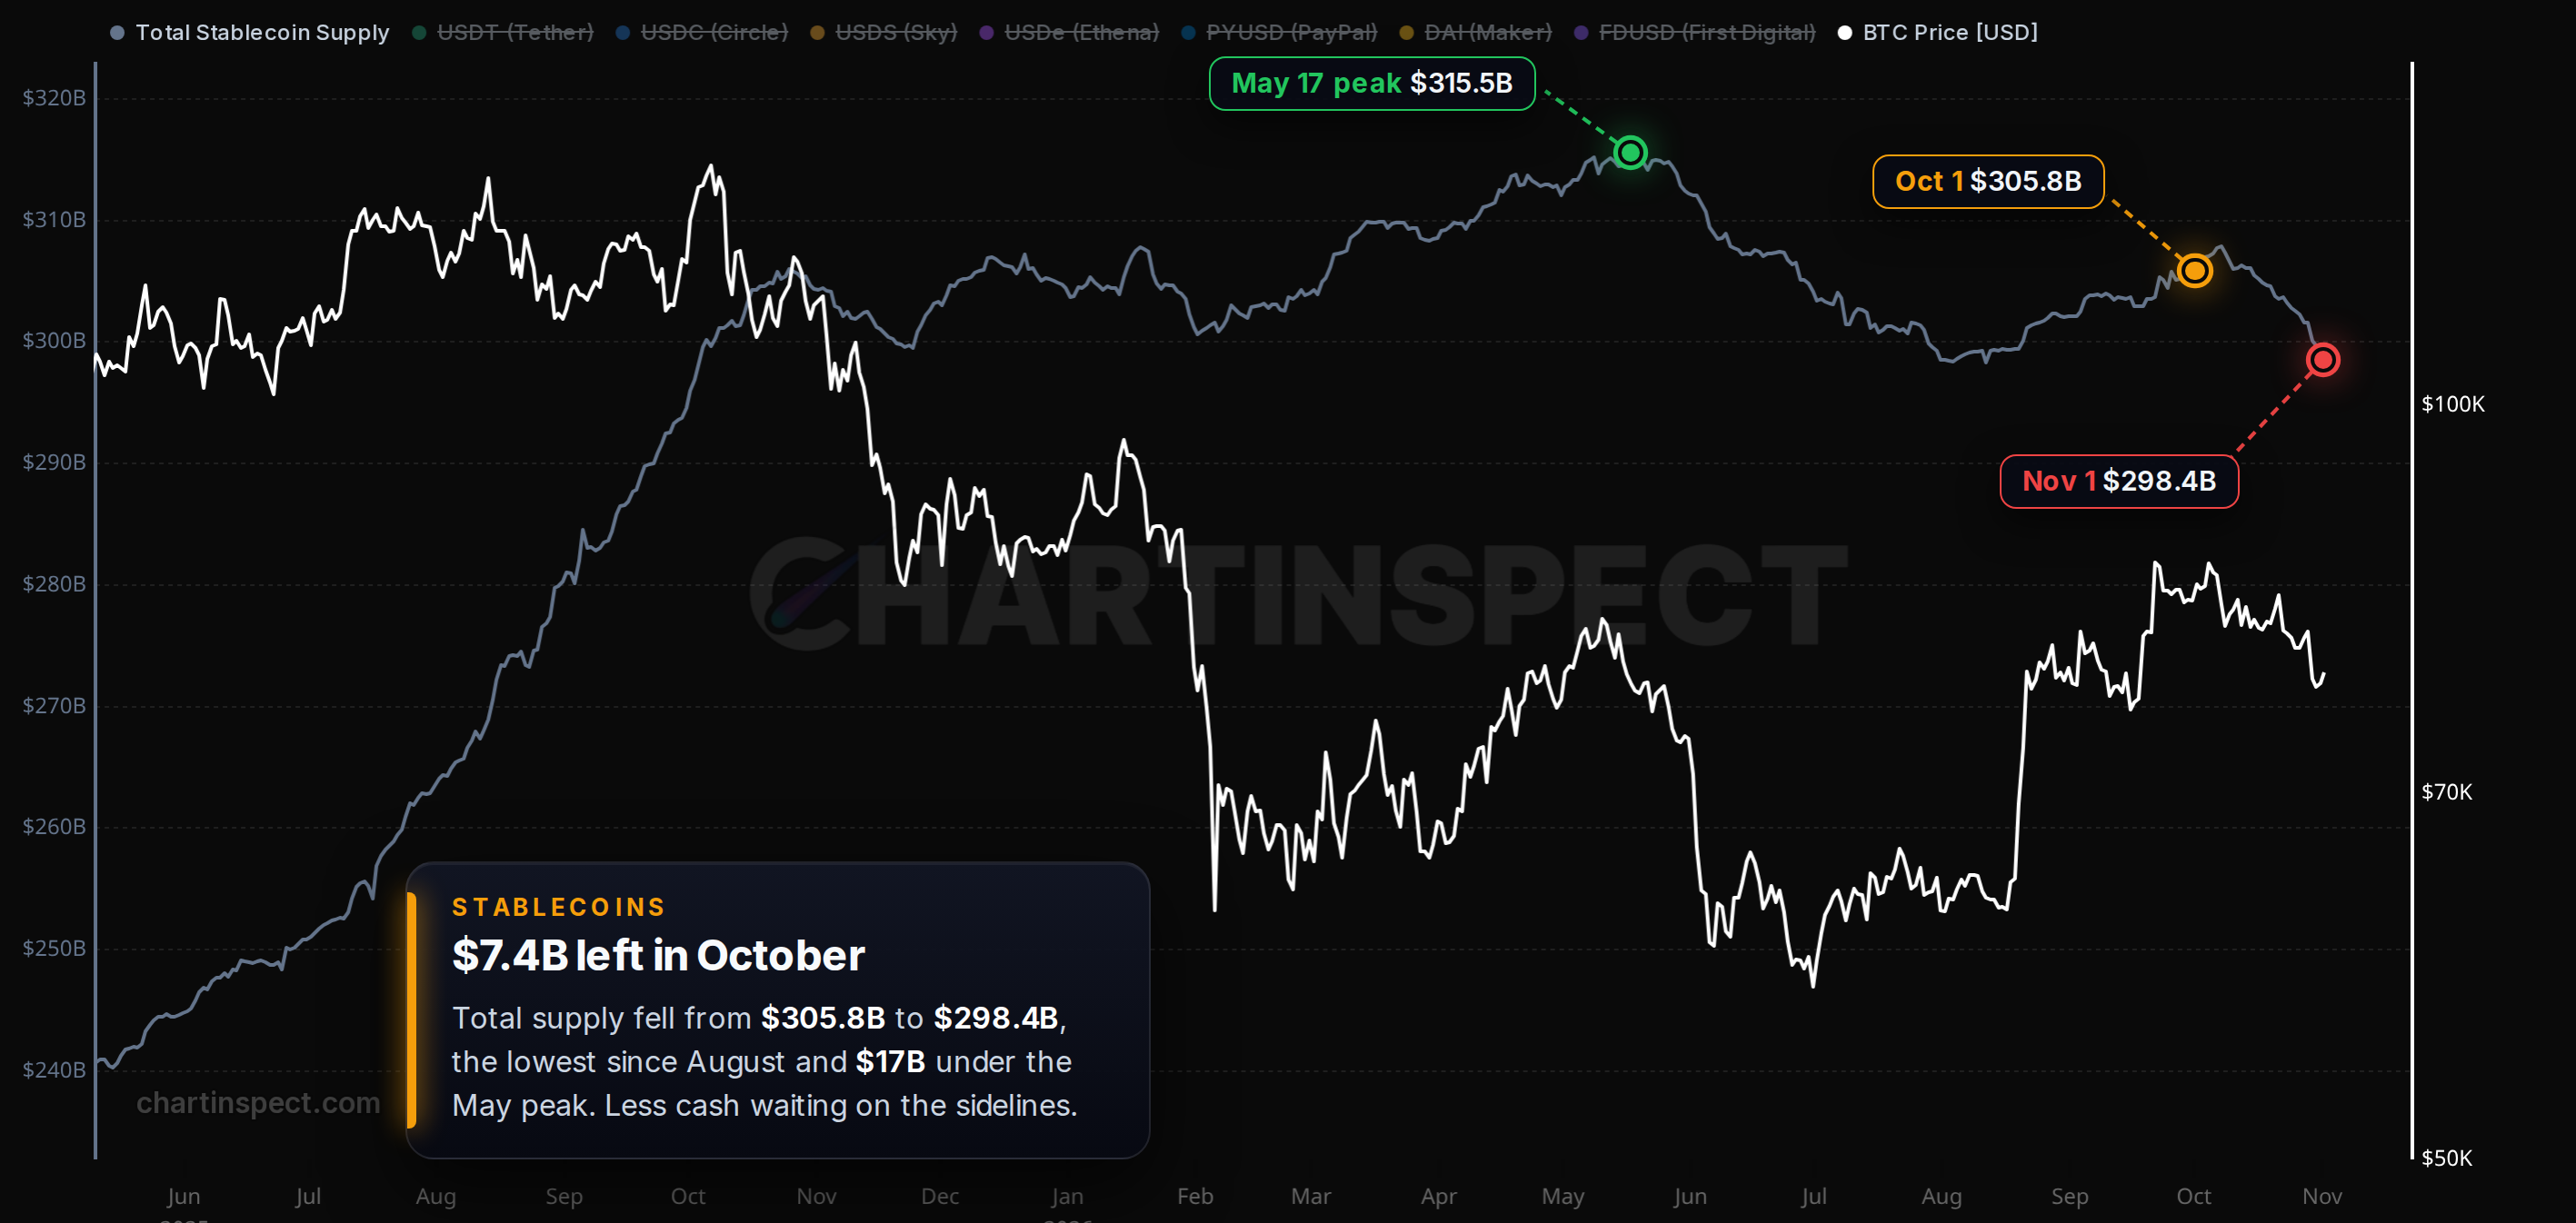
Stablecoins. This is the part I like least. The total supply of the major dollar stablecoins fell from $305.8 billion on October 1 to $298.4 billion on November 1, a drop of $7.4 billion in a month. That's below where it was a year ago ($304.3 billion) and $17 billion under its May peak of $315.5 billion. Stablecoins are the cash waiting on the sidelines in crypto, and right now there's a bit less of it.
The line Bitcoin can't lose
The line I care more about is the median cost basis, about $66,000. Half of all Bitcoin last moved below this price and half above, so it's the typical holder's cost basis. Bitcoin is about 17% above it.
There's a second reason I like $66K. The coins bought three to six months ago, mostly around the June low and through the summer, have an average cost of $66,374. Two completely different measures land on almost the same price.
What's unusual right now is how close the two lines are. In the dips I listed above, the median sat 27% to 57% below the short-term holder line. Today it's only 13% below it. I went looking for the last time they were this close at a retest, and it was March 2023, the first retest after the 2022 bottom:
| March 2023 | Now | |
|---|---|---|
| Gap between the two lines | 13.4% | 13.2% |
| Retest low vs the short-term line | 2.3% above | 1.8% above |
| Retest low vs the median | 17.6% above | about 17% above |
| A month later | $20,214 to $29,652 (+47%) | ? |
History won't repeat exactly, and one match isn't proof of anything. But it's the closest setup I can find, and it came right after a cycle bottom, which is where I think we are.
The tight gap cuts both ways, though. A dip like September 2023, about 10% under the short-term line, would take Bitcoin to around $68,300 and still hold above the median. A dip like April 2025, about 18% under, would take it to around $62,100, below the median. In my opinion going below it at this stage of the market is unlikely, but if we start closing weeks under it, I'll take that seriously.
Ethereum (this wasn't in the video)
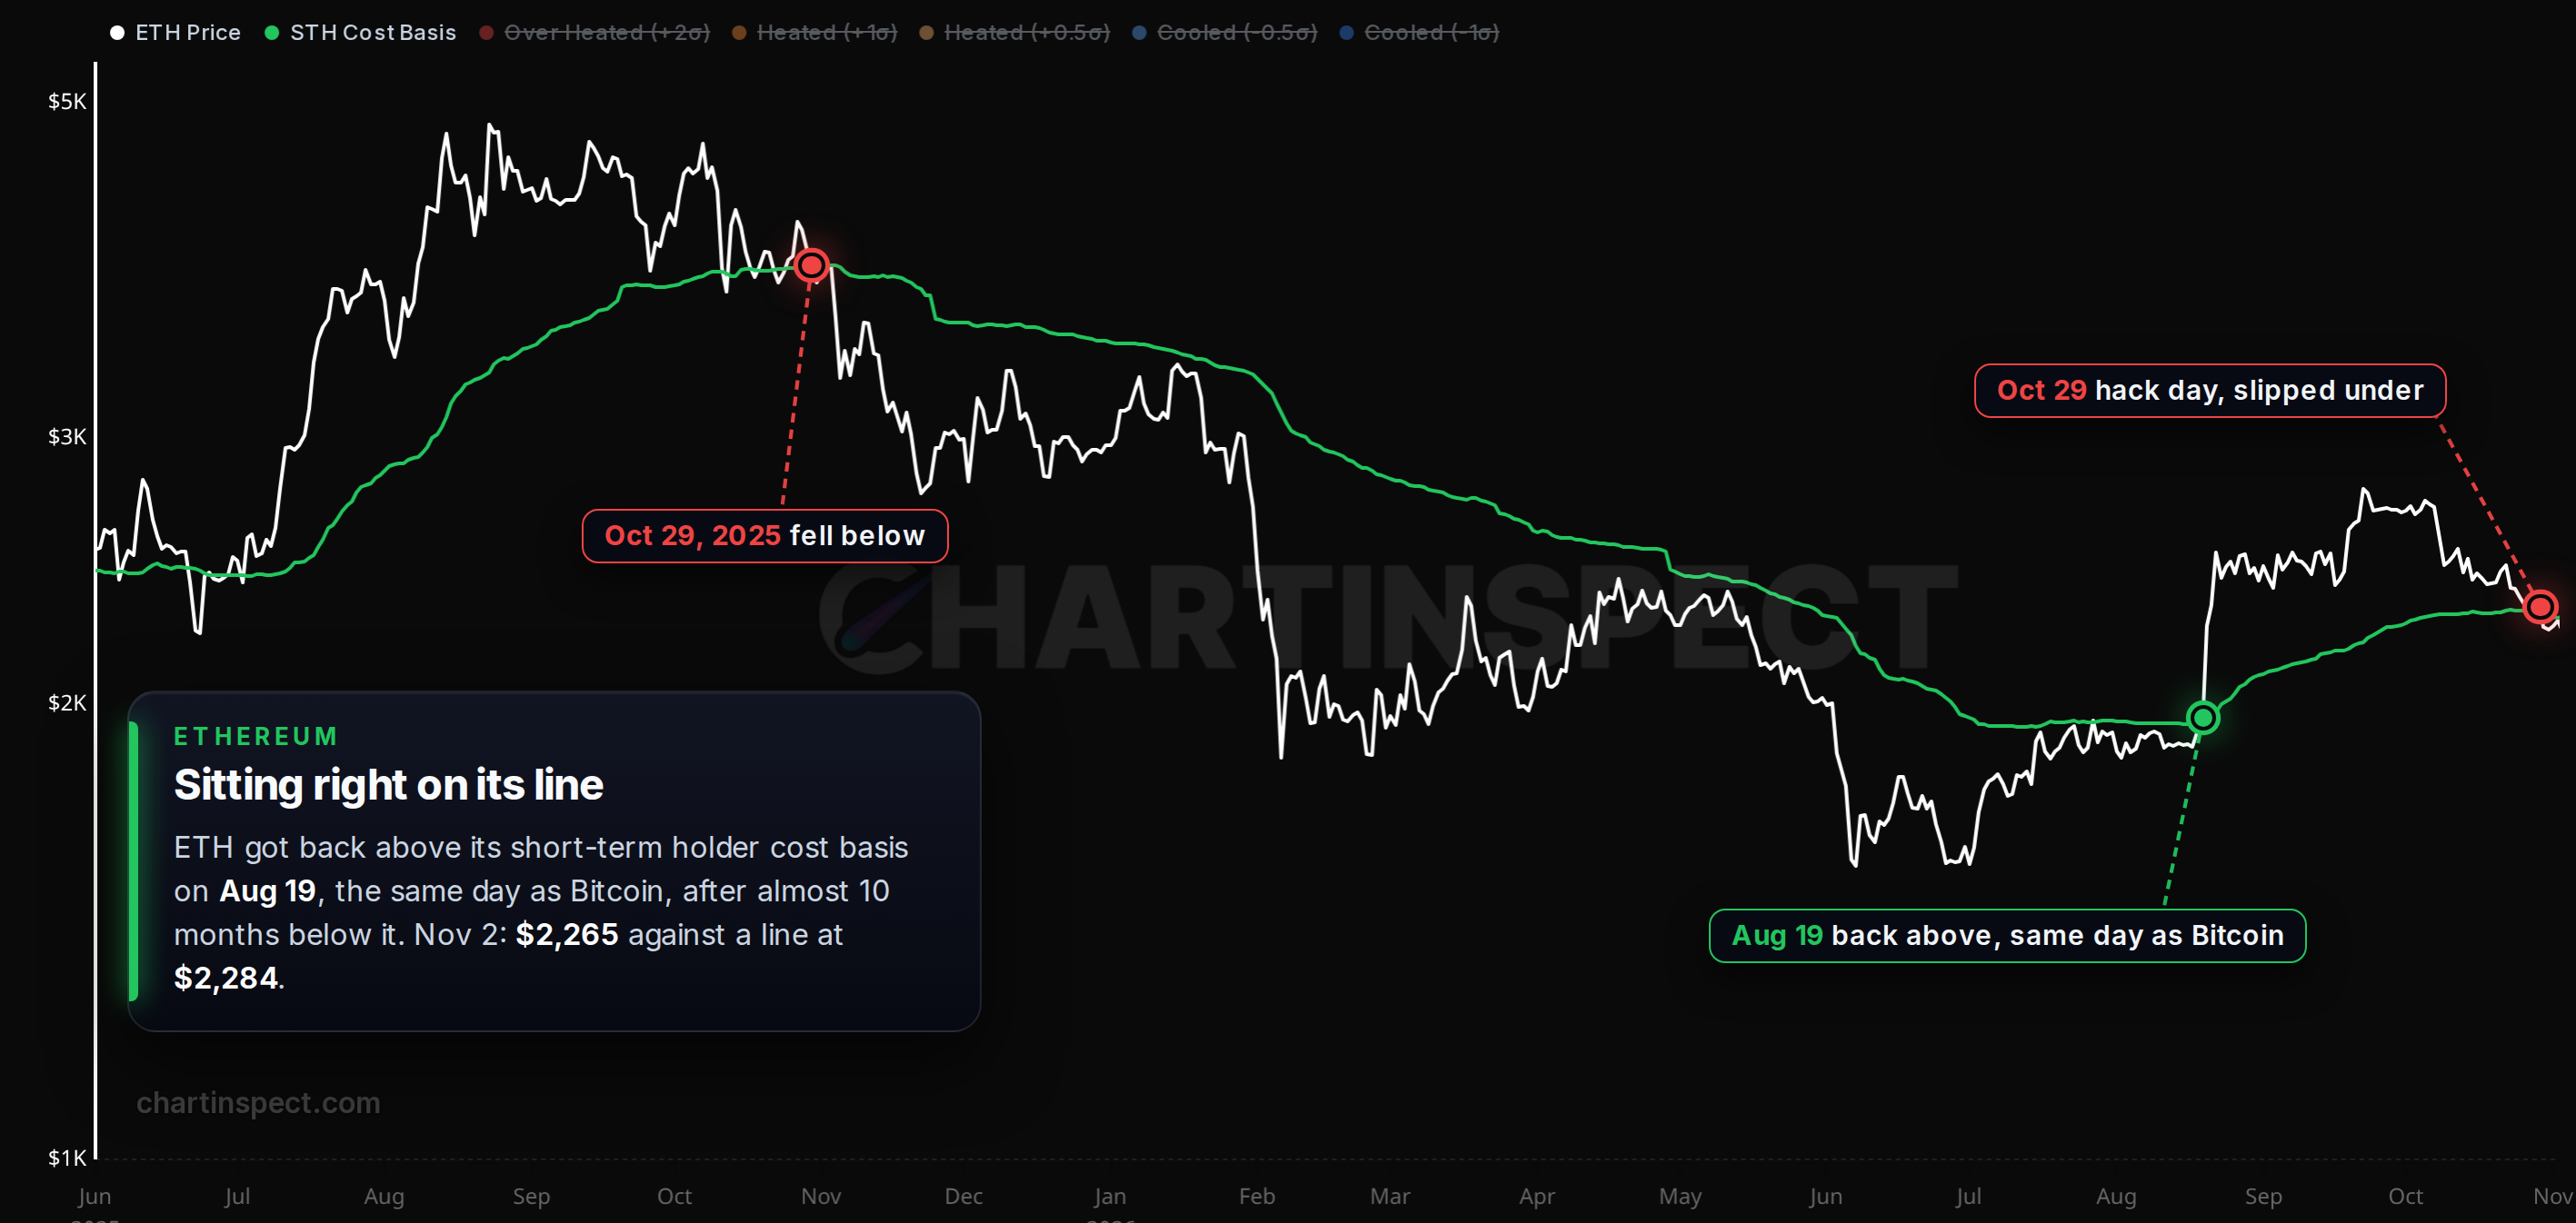
The hackers also took about 200,000 ETH, roughly $450 million at today's price. Ethereum is at $2,265, and its short-term holder cost basis is $2,284, so it's sitting right on the line, less than 1% under it. For Ethereum this is the level I'd watch. Daily closes back above it put recent buyers in profit again. Weeks below it would mean they're underwater, which is when people tend to sell. Personally I'm still bullish on Ethereum long term.
Open STH Cost Basis (switch the chain to Ethereum)
What 2022 taught me, and my strategy
In 2022 I bought as much as I could between $15,000 and $20,000. Then I took profits too soon, because I expected more sideways chop. What I learned is that once Bitcoin gets back above the short-term holder line, recent buyers are back in profit, and more upside is usually the likely path.
That's why I built the STH Line strategy, which is free to open in Studio. It buys when Bitcoin closes 5% above the short-term holder cost basis, sells when it closes 5% below it, and also buys crashes far under the line. It bought on January 12, 2023 at $18,853, and it has been long again since August 20 at $73,025. It only sells on a close below about $72,100 today. From the start of 2022, $1,000 in the strategy would be about $6,350 now, against about $1,630 for just holding Bitcoin.
Open the STH Line strategy in Studio
That's a backtest with settings chosen using all the data, so it's a guide, not a promise.
Where I stand
Here are the levels I'm watching:
-
Above $75,900: recent buyers stay in profit, and I see that as the normal path.
-
Below $75,900 for a few weeks, like in 2023: I don't think that changes the bigger picture as long as Bitcoin stays above about $66,000.
-
A close below about $72,100: my strategy sells, and I'd start paying more attention to the downside case.
-
Weekly closes below about $66,000: I'd take that seriously. That's also back inside the prior accumulation zone, so if you believe in Bitcoin long term, it isn't necessarily a bad place to be buying.
The risk I'm watching most is the hackers themselves. TRM Labs says they still control about $2.4 billion of Bitcoin and Ether. If they start moving it to exchanges and selling it, that's real supply hitting the market, and I'm not going to downplay that. Shrinking stablecoin supply is the other thing I don't love.
But looking at the on-chain data as a whole, this looks like a normal retest with nervous holders, not a market that's breaking. History is a guide, not a guarantee, and if the data changes, I'll change my view and tell you.
All of these charts are on ChartInspect, and most of them are free.
Not financial advice. Do your own research.
Enjoyed this article?
Subscribe to get the latest research in your inbox.
Comments
Sign in to join the discussion.