The Second Chance
More Bitcoin is at a loss than in profit for the first time since August, and Ethereum is deeper still. Here's what happened after every other time, how the altcoins, long-term holders and miners are holding up, and the one level that would prove me wrong.

On Saturday, more Bitcoin was sitting at a loss than in profit, for the first time since August. In this week's video I went through why I think that makes Bitcoin and Ethereum undervalued here, and what would prove me wrong. In this letter I'll go deeper on that, and get into the altcoins, long-term holders, realized losses, the miners, the exchanges and leverage.
As I write this on November 16, 2026, Bitcoin is at $64,459. It was at $81,249 on October 28, so that's a drop of about 21% in under three weeks, with an intraday low near $62,080 on Sunday.
The short version
| Level | Price | Why I watch it |
|---|---|---|
| True market mean | $77,059 | The average cost of coins that actually move |
| Short-term holder cost basis | $74,423 | Recent buyers break even here |
| Median cost basis | $65,828 | Half of all Bitcoin last moved below this |
| Bitcoin | $64,459 | November 16 |
| June low | $58,625 | A daily close below it changes my view |
| Realized price | $53,656 | What the average coin last cost |
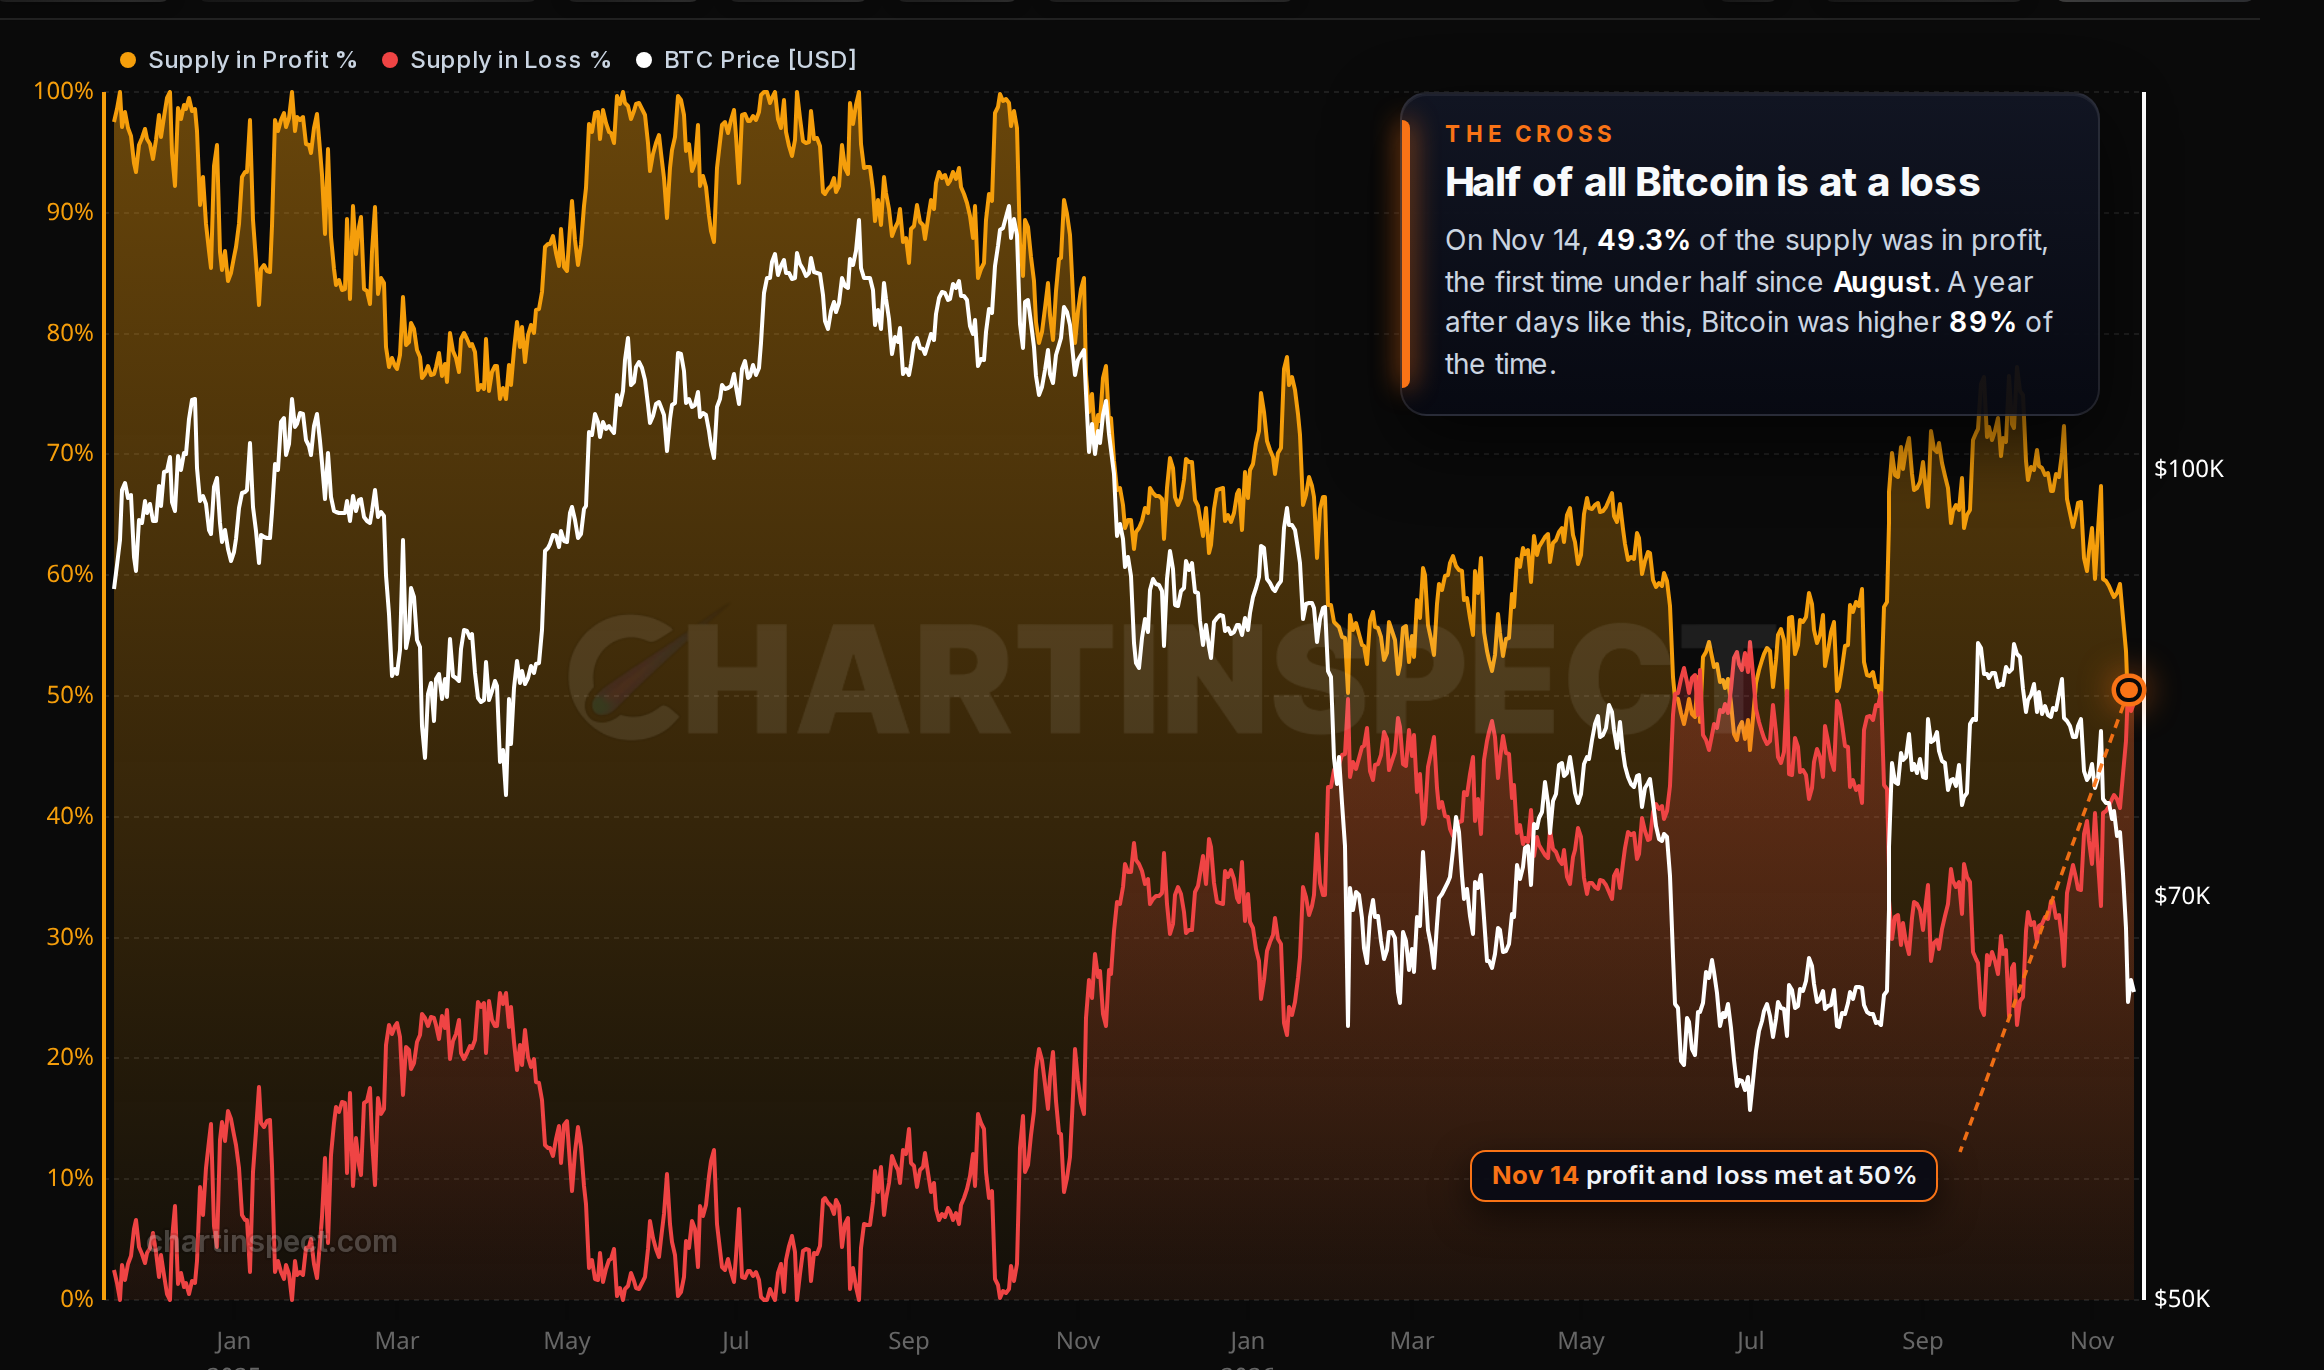
- About half of all Bitcoin is at a loss. On Saturday 49.3% of the supply was in profit. Today it's 50.6%, so we're sitting right on the line.
- That has been rare, and patient buyers were paid for it. Since 2012, only about 1 day in 10 had this little supply in profit. A year later Bitcoin was higher 89% of the time. Three months later, only 58%.
- The level that decides it is the June low. Bitcoin's lowest close this time is $64,119, against $58,625 in June. If that holds, it's a higher low. If Bitcoin closes below it, I'm wrong.
It wasn't only Bitcoin
Bitcoin didn't fall on its own. On November 5 the Nasdaq dropped about 5.5% in one day, around $2.5 trillion, on fears that the midterm results could slow the AI buildout. Then Nvidia opened an investigation into Jensen Huang's relationship with a businesswoman who, according to CNBC, intelligence agencies say is a Chinese spy. He resigned as CEO on Thursday, and the stock is about a third below the all-time high it made less than six weeks ago.
October inflation also came in hot, and the market now gives about a 90% chance that the Fed raises rates on December 9. The one thing going the other way is oil, which has dropped for two weeks on hopes of a diplomatic end to the Iran war.
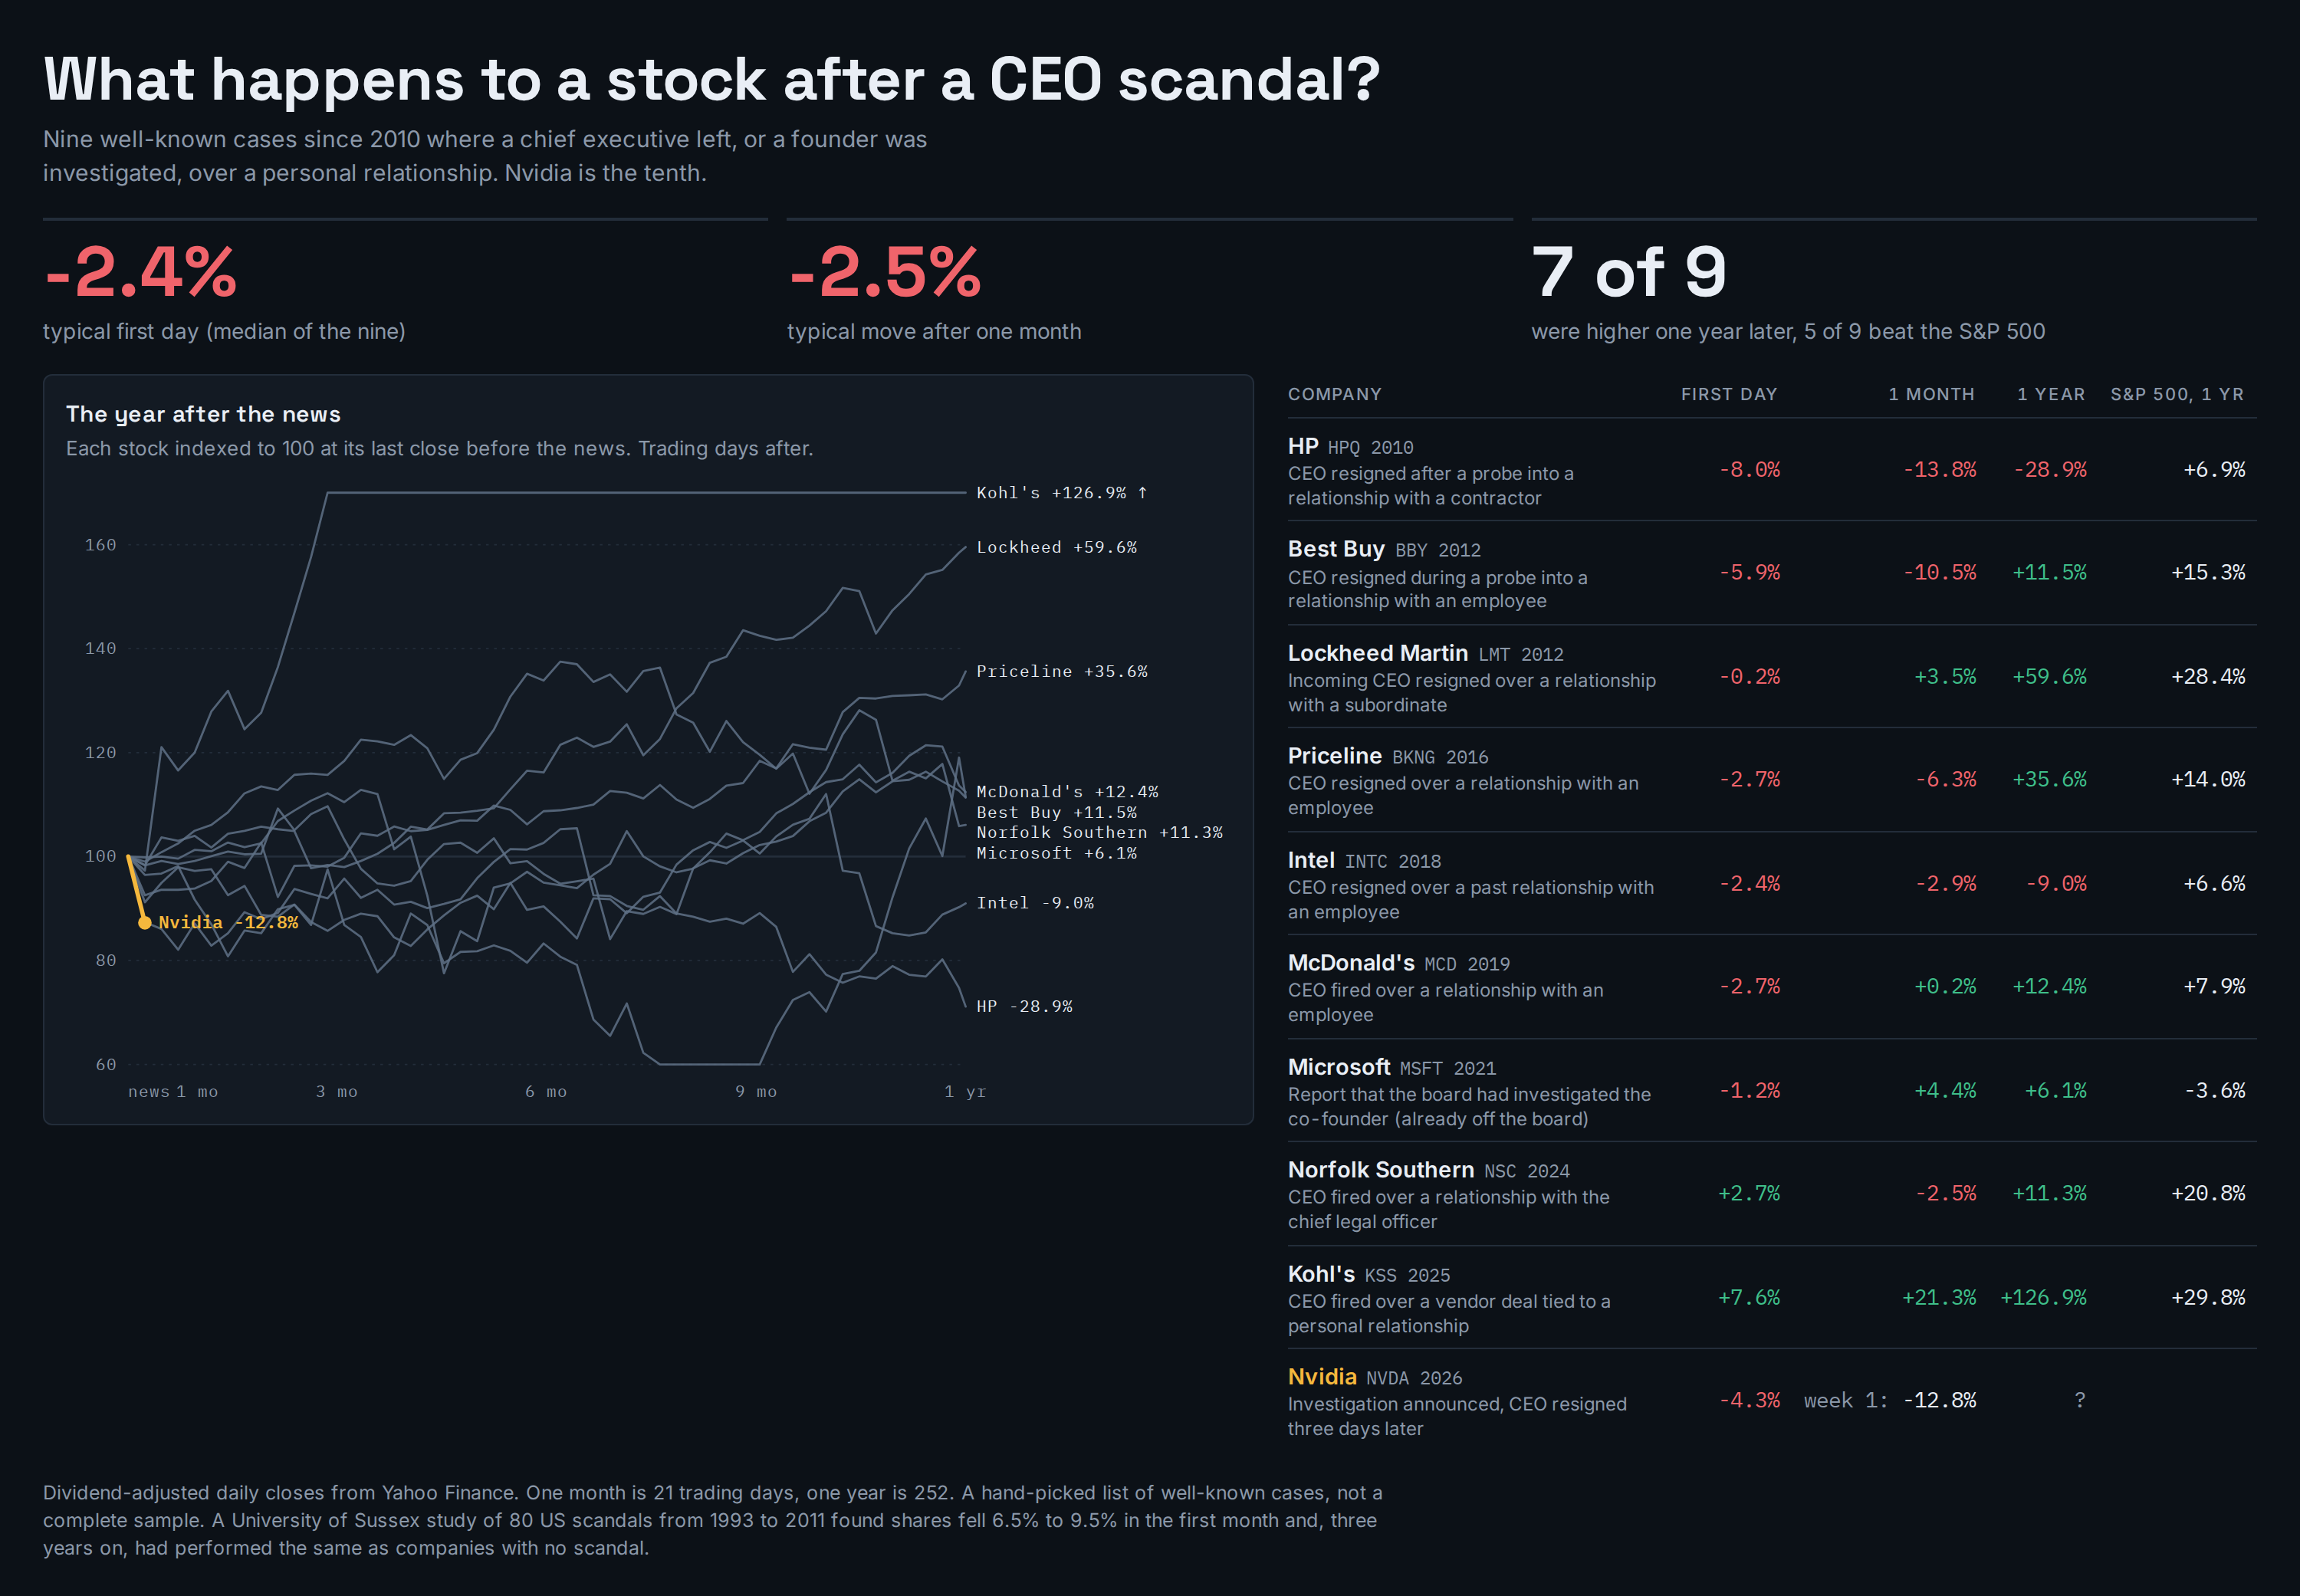
For the video I pulled the stock prices for nine well-known cases since 2010 where a CEO left, or a founder was investigated, over a personal relationship.
| Typical move (median of nine) | |
|---|---|
| First day | -2.4% |
| One month later | -2.5% |
| One year later | +11.5%, with 7 of 9 higher |
| Beat the S&P 500 over that year | 5 of 9 |
Nvidia fell about 13% in its first week, so the market is treating this one as bigger than usual, and I think that's fair. He founded the company, he's out, and there's an investigation. A University of Sussex study of 80 scandals found the same pattern as my nine: the stocks fell 6.5% to 9.5% in the first month, and three years later they had performed the same as companies with no scandal. Nvidia reports earnings on Tuesday, and that will matter more than the headline.
The cross, and what came after it
Open Supply In Profit and Loss
This chart splits every Bitcoin into two groups, coins in profit and coins at a loss. When the two lines meet, half the supply is underwater.
The honest way to read the history is in two parts. Over one year, buying when this little supply was in profit worked 89% of the time, with a typical gain of about 86%. Over three months it was close to a coin flip, and the worst case was a 53% drop. So this is a signal for people who can wait, not for a quick trade.
The first time it crossed in past bear markets, the low was still a long way off:
| First cross | Price | Later low | Further drop |
|---|---|---|---|
| September 2014 | $458 | $178 | -61% |
| November 2018 | $5,809 | $3,281 | -44% |
| June 2022 | $20,381 | $15,774 | -23% |
| June 2026 | $64,045 | $58,625 | -8% |
In 2022 it crossed twice, in June and again in August, and the real low came in November. A cross on its own doesn't mark the bottom. This cycle's first cross was in June, Bitcoin fell another 8%, and then went to $86,595 by September. The question now is whether that June low holds a second time.
Is Bitcoin undervalued?
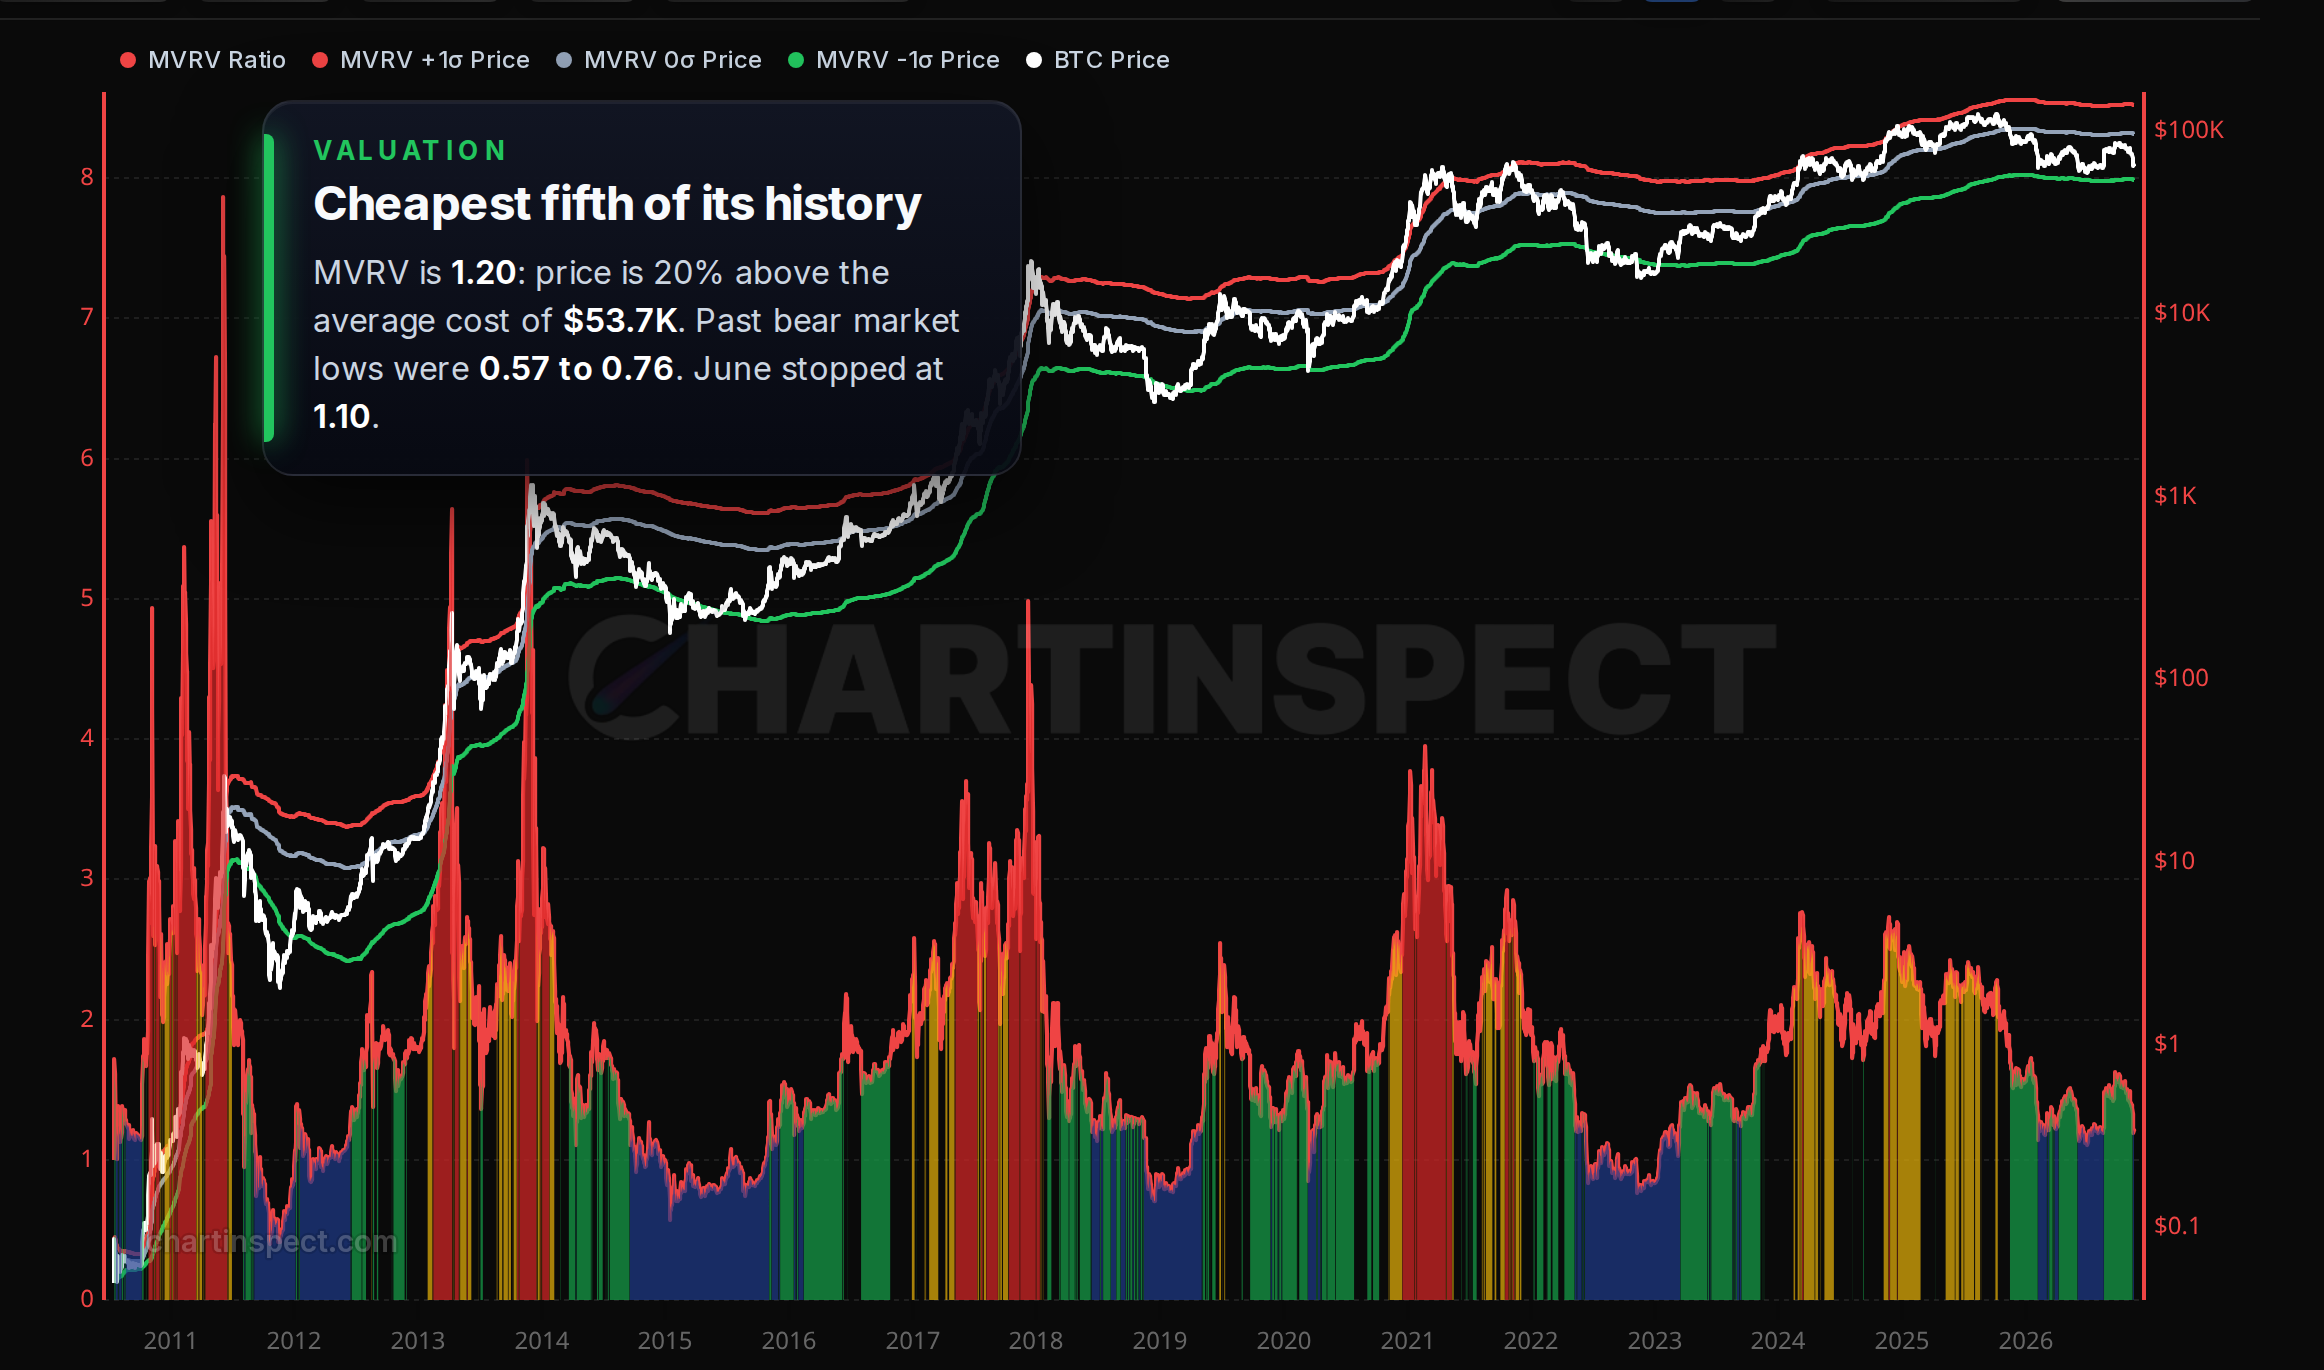
MVRV compares price with the realized price, the average price everyone paid. The realized price is $53,656, so Bitcoin is trading about 20% above the average cost basis. That's in roughly the cheapest fifth of Bitcoin's history, and from valuations like this one, Bitcoin was higher a year later about 90% of the time. Bitcoin is also 48% below its all-time high.
It's not as cheap as a real bear market bottom, and I want to be clear about that:
| Low | MVRV at the low |
|---|---|
| January 2015 | 0.57 |
| December 2018 | 0.70 |
| November 2022 | 0.76 |
| June 2026 | 1.10 |
In those three bear markets, price went below the average cost. This cycle it never has. In June it stopped 10% above it. If you're waiting for 2022-style cheap, you're waiting for about $54,000 or lower. A lot of people waited for that in June, and it never came.
Ethereum
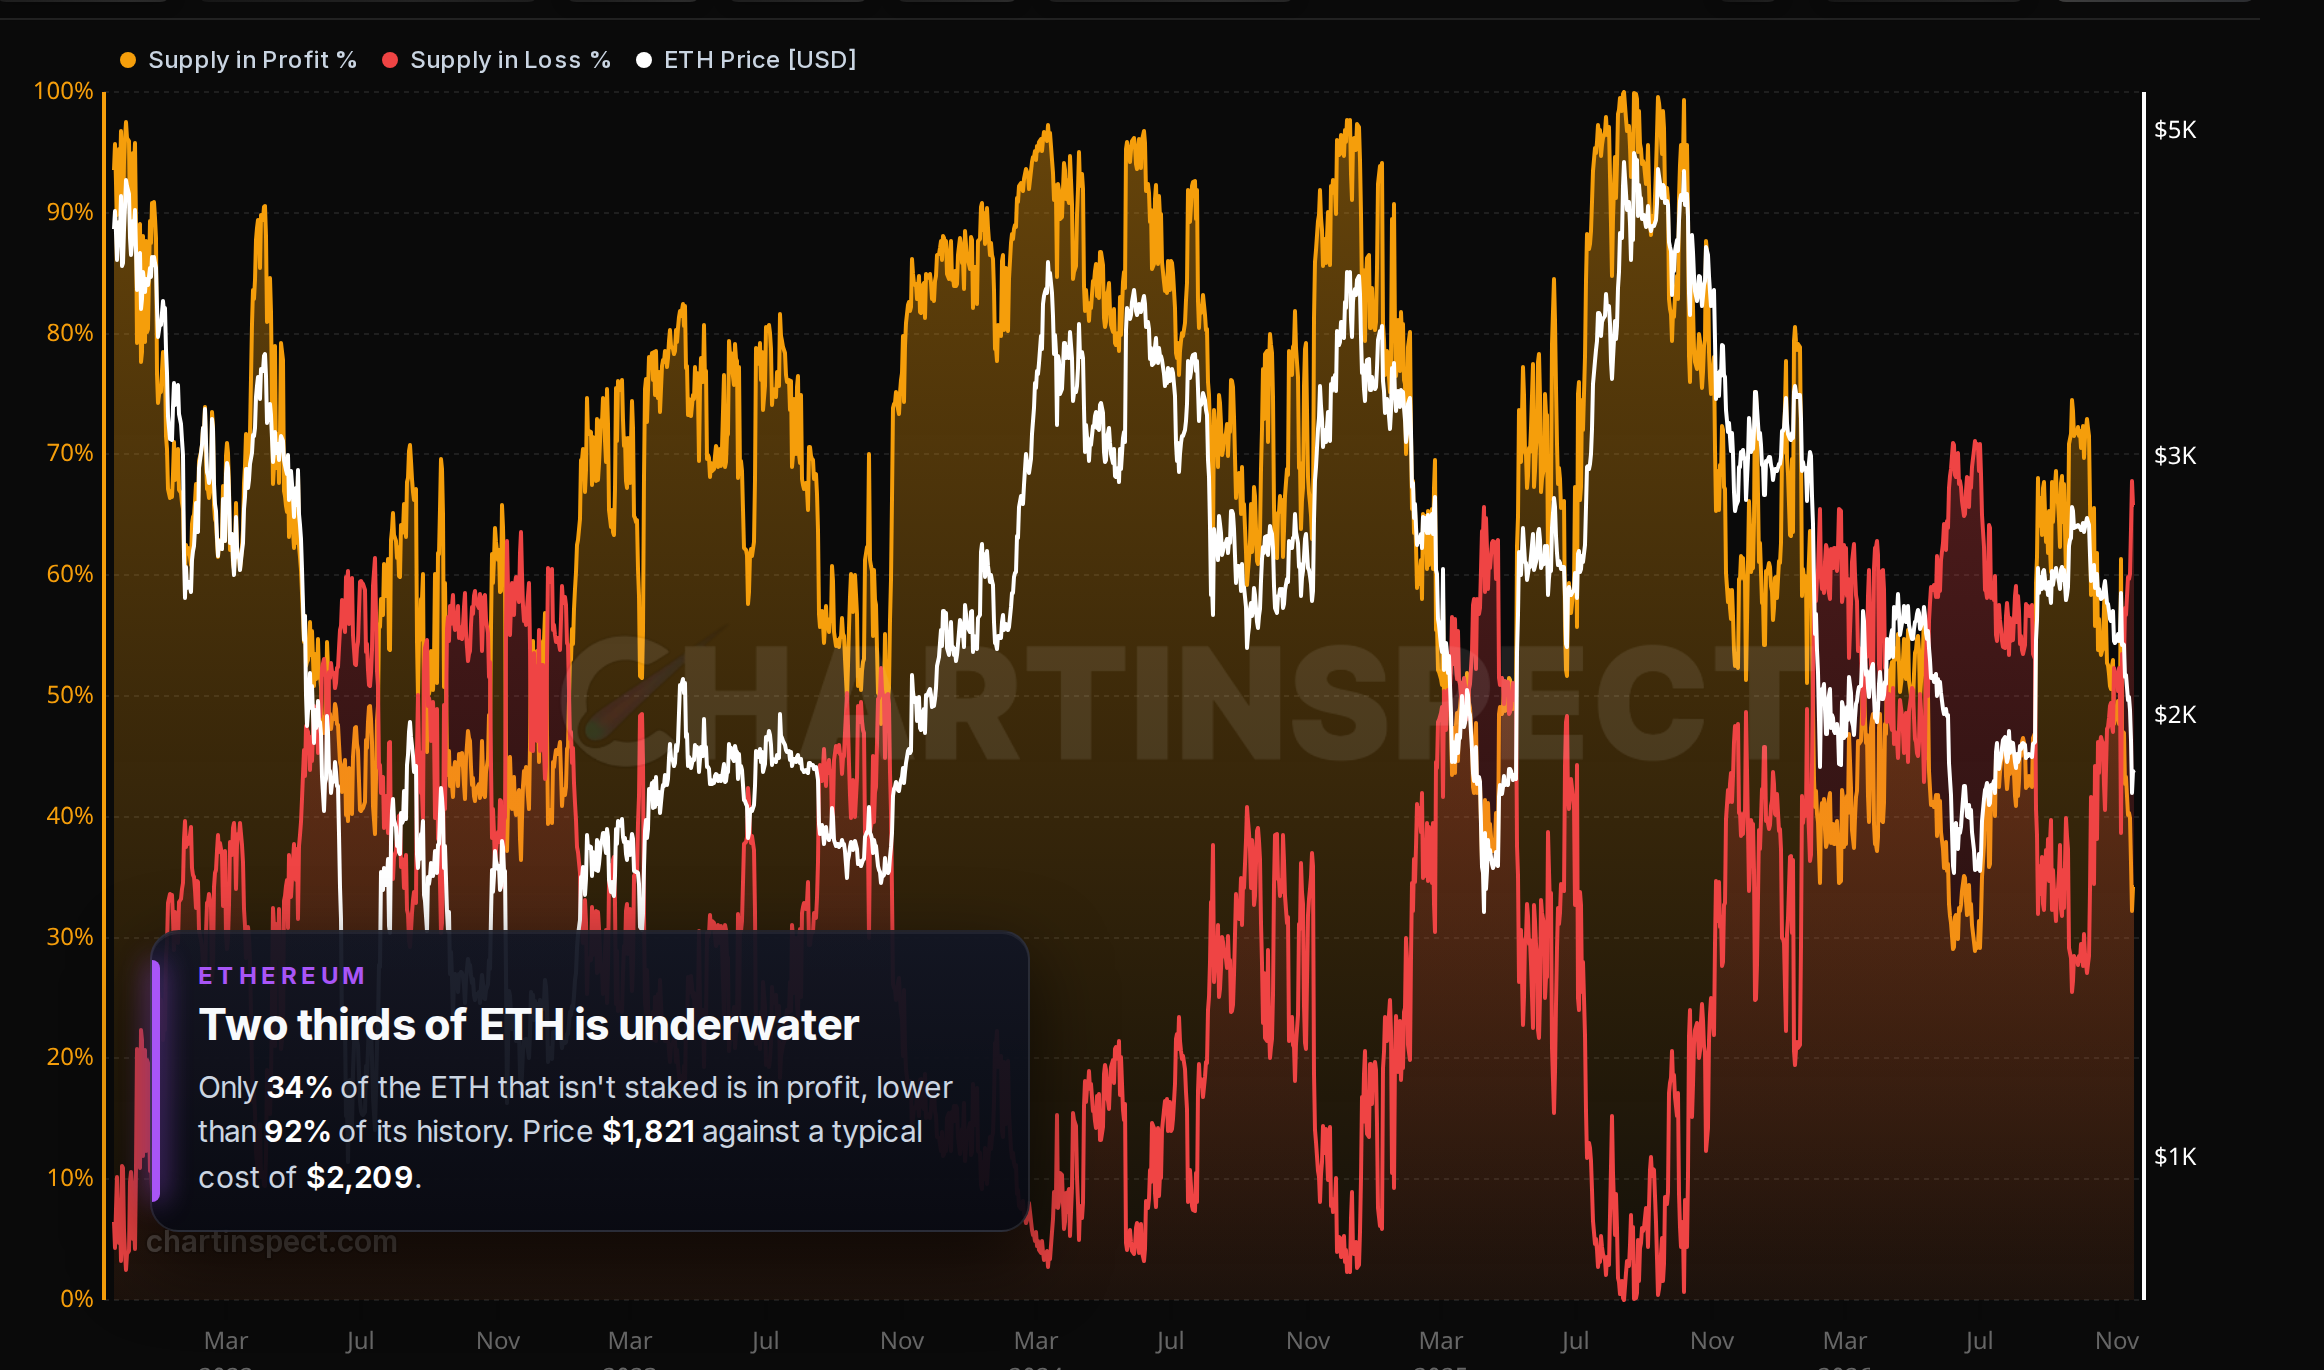
Ethereum is deeper in loss than Bitcoin. Only 34% of the ETH that isn't staked is in profit, and it has been lower than that just 8% of the time. Loss has been above profit every day since November 5.
The typical ETH coin last moved at $2,209, and the short-term holder cost basis is $2,220. Price is $1,821, so Ethereum is about 18% below what the typical holder paid. In our data, every time before this year that Ethereum had this little supply in profit, it was higher one year later. At the June low it was 29% in profit at $1,563, so like Bitcoin it's holding a higher low so far.
The altcoins took it much harder
| Asset | Supply in profit today | A month ago |
|---|---|---|
| Bitcoin | 50.6% | 67.0% |
| XRP | 35.5% | 43.5% |
| Ethereum | 34.0% | 53.4% |
| Chainlink | 19.2% | 38.6% |
| Dogecoin | 16.7% | 37.7% |
| Litecoin | 10.6% | 36.0% |
| Cardano | 6.0% | 20.8% |
For Cardano, 94% of the supply is at a loss, which is close to the worst reading in its history. Bitcoin lost about 16 points of supply in profit in a month. Litecoin lost 25 and Chainlink 19. If you only looked at Bitcoin you would think this was a normal correction. The altcoin holders are in a much worse place.
Long-term holders are underwater too
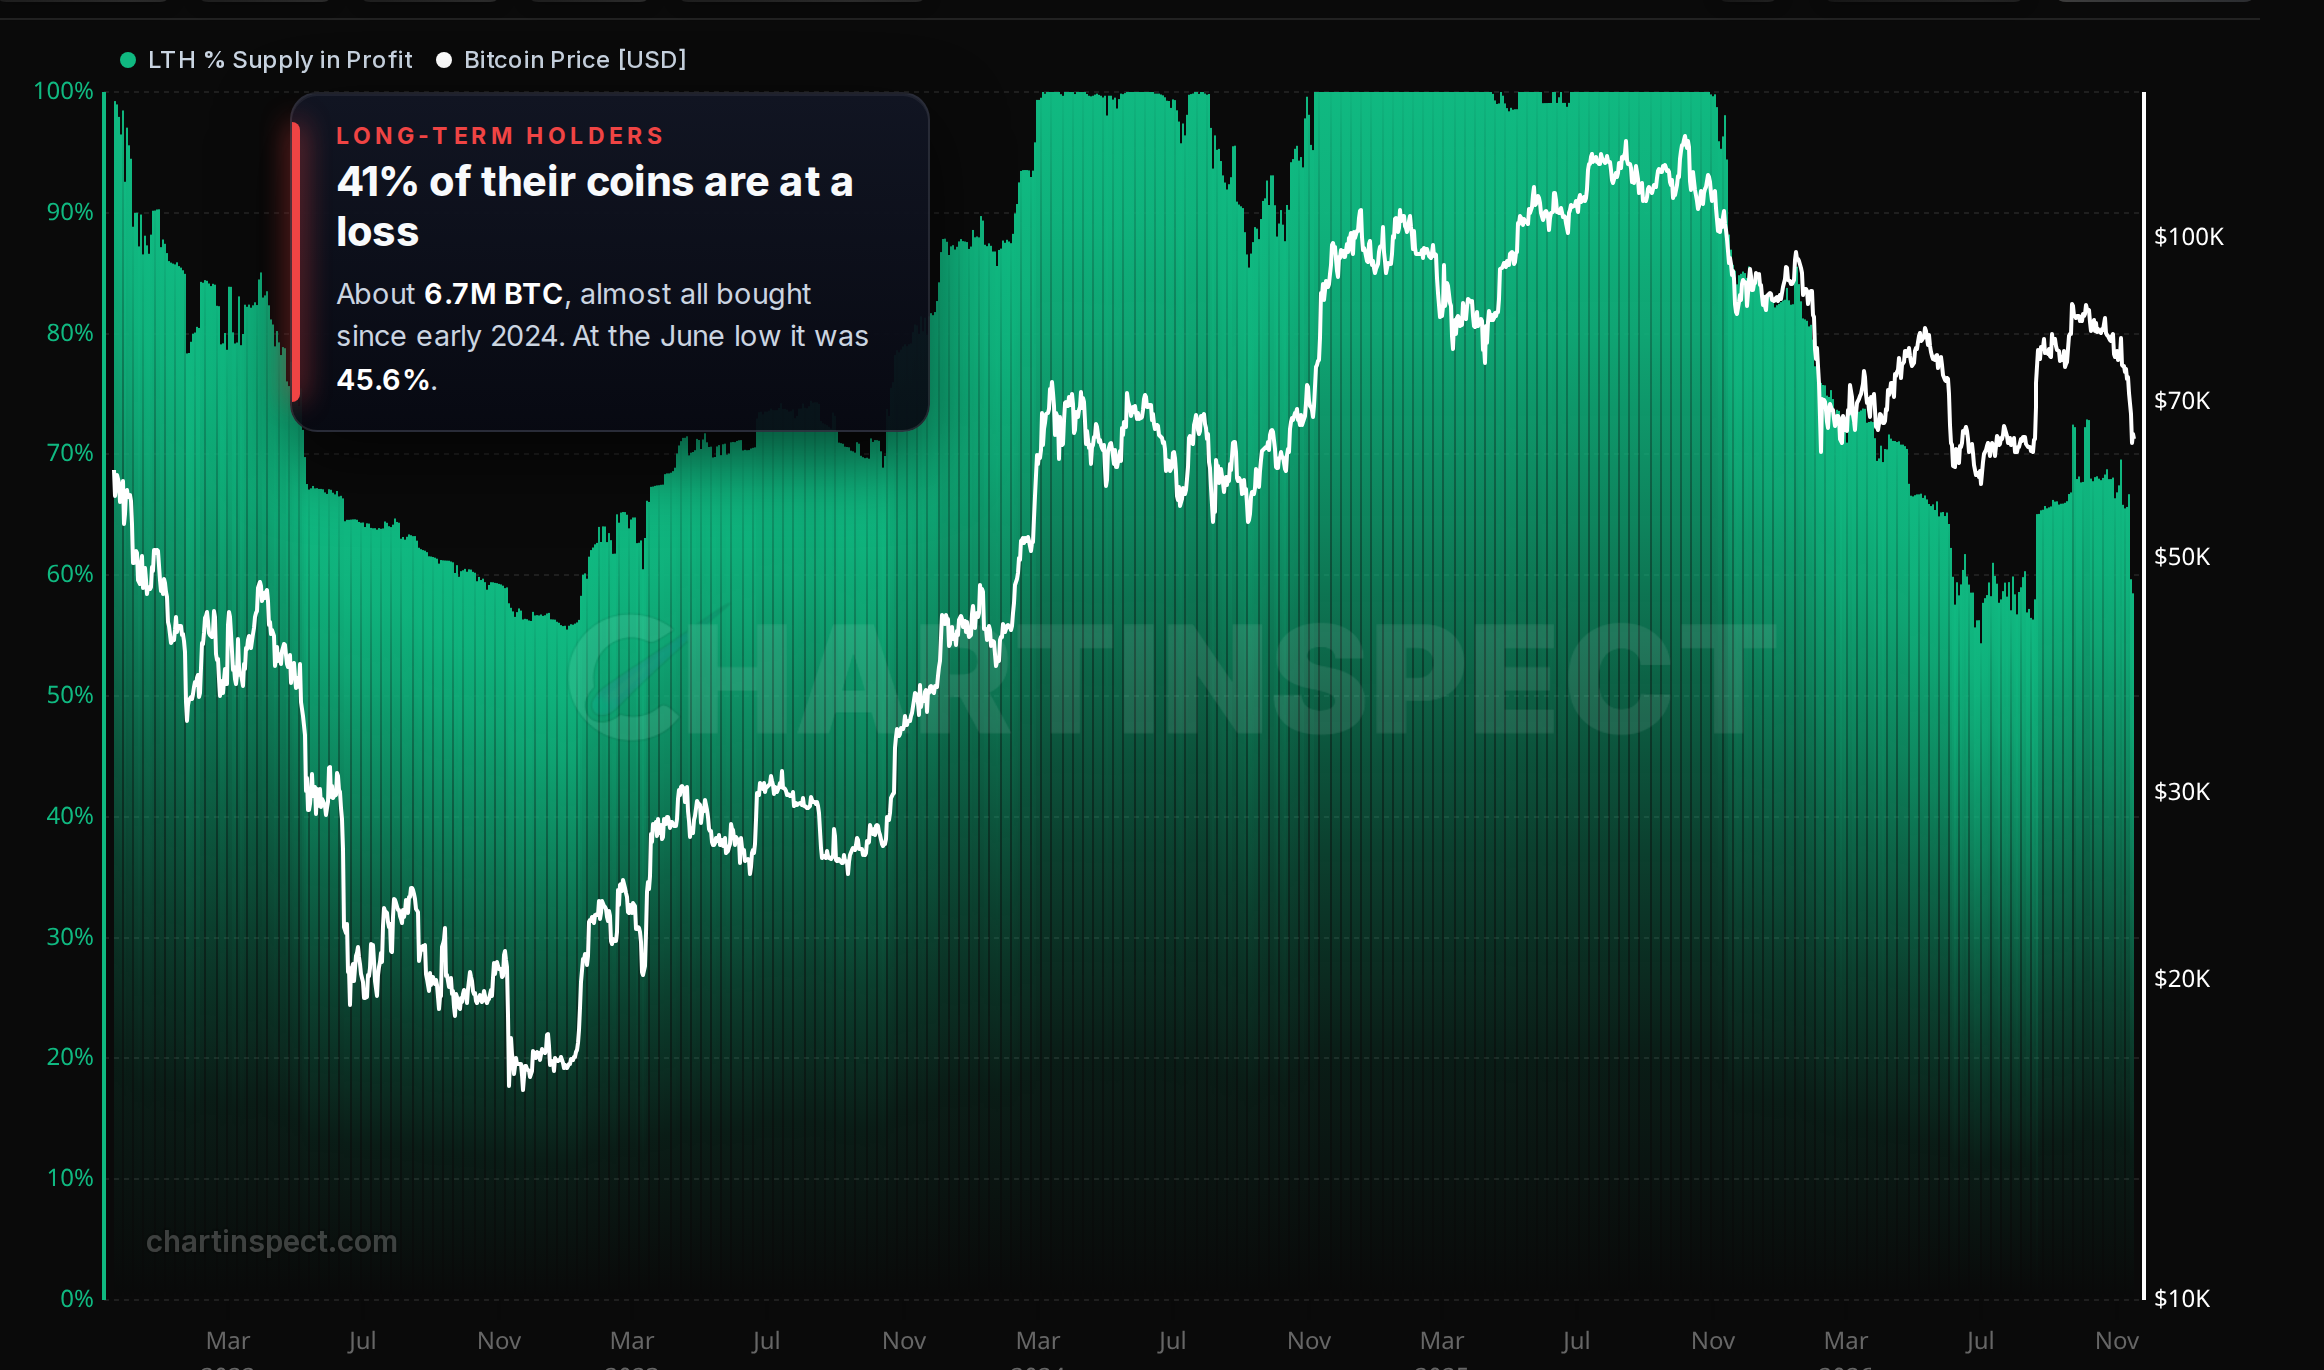
We usually think of long-term holders as the people sitting on big gains. Right now 41.5% of their coins are at a loss, about 6.7 million BTC. Almost all of those were bought since early 2024, above today's price. At the June low it was 45.6%, so this is close to the most stress long-term holders have been under this cycle.
Some of them are selling. Long-term holder supply is down about 80,000 BTC since the start of November, roughly half a percent, and on Thursday and Friday they realized more losses than profits. Coins that are one to two years old were sold at around a third below what they cost. That's people who bought near last year's highs giving up.
The losses are real, but smaller than June
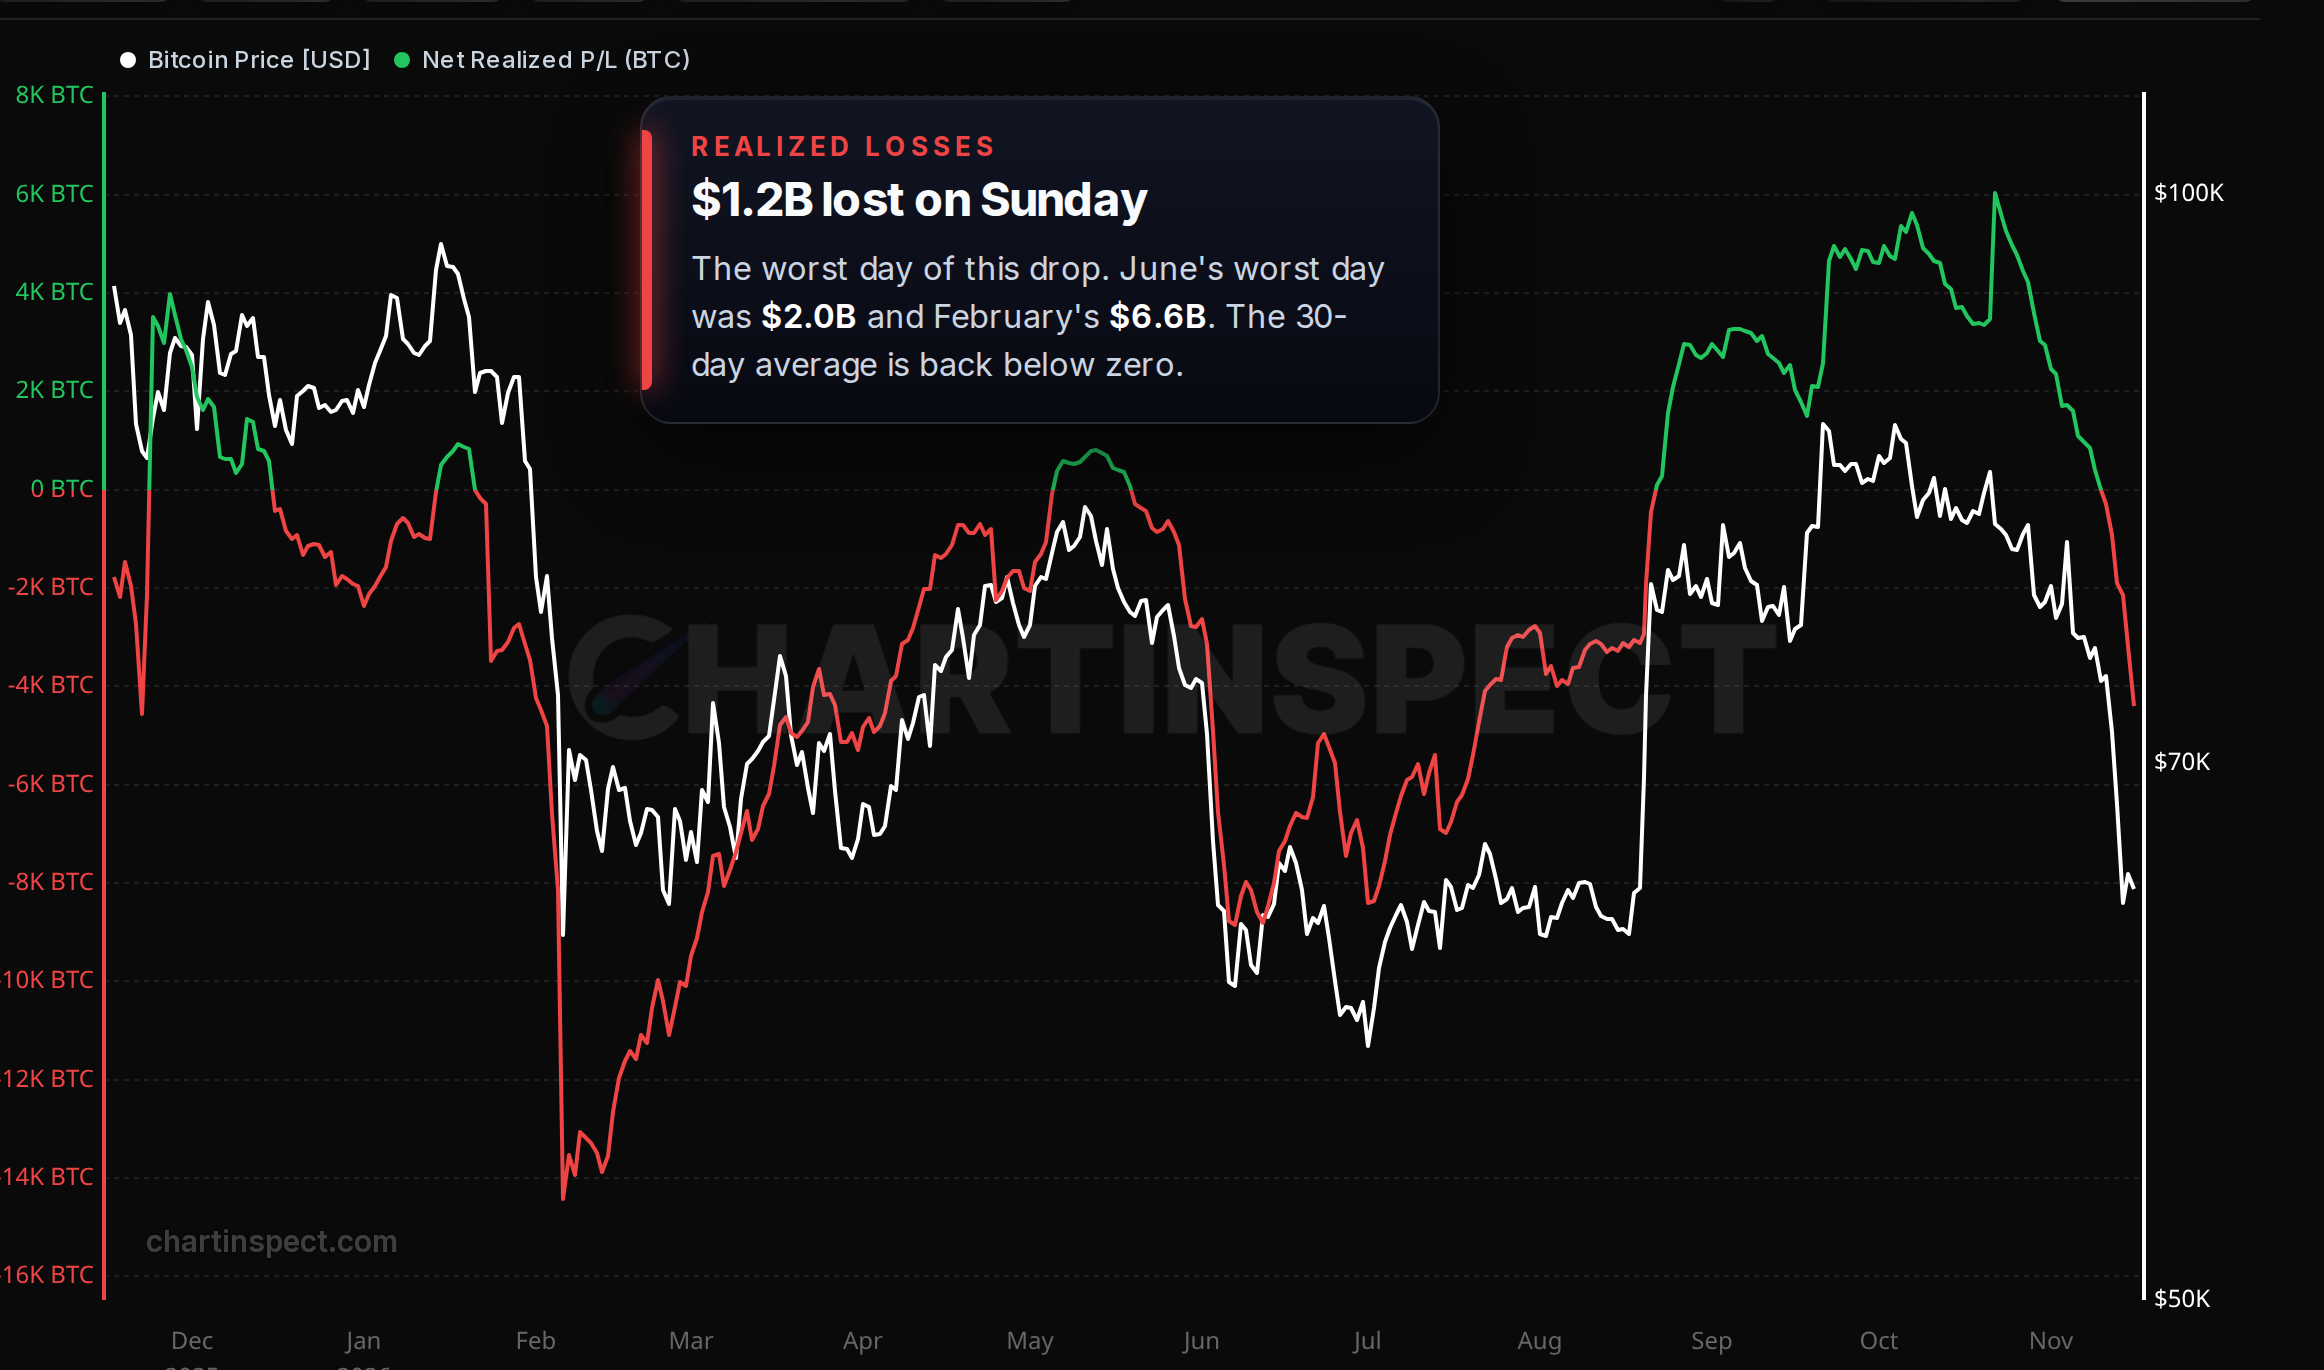
Open Net Realized Profit and Loss
The worst day of this drop was Sunday, with about $1.2 billion of net realized losses. In June the worst day was about $2 billion, and in February it was $6.6 billion.
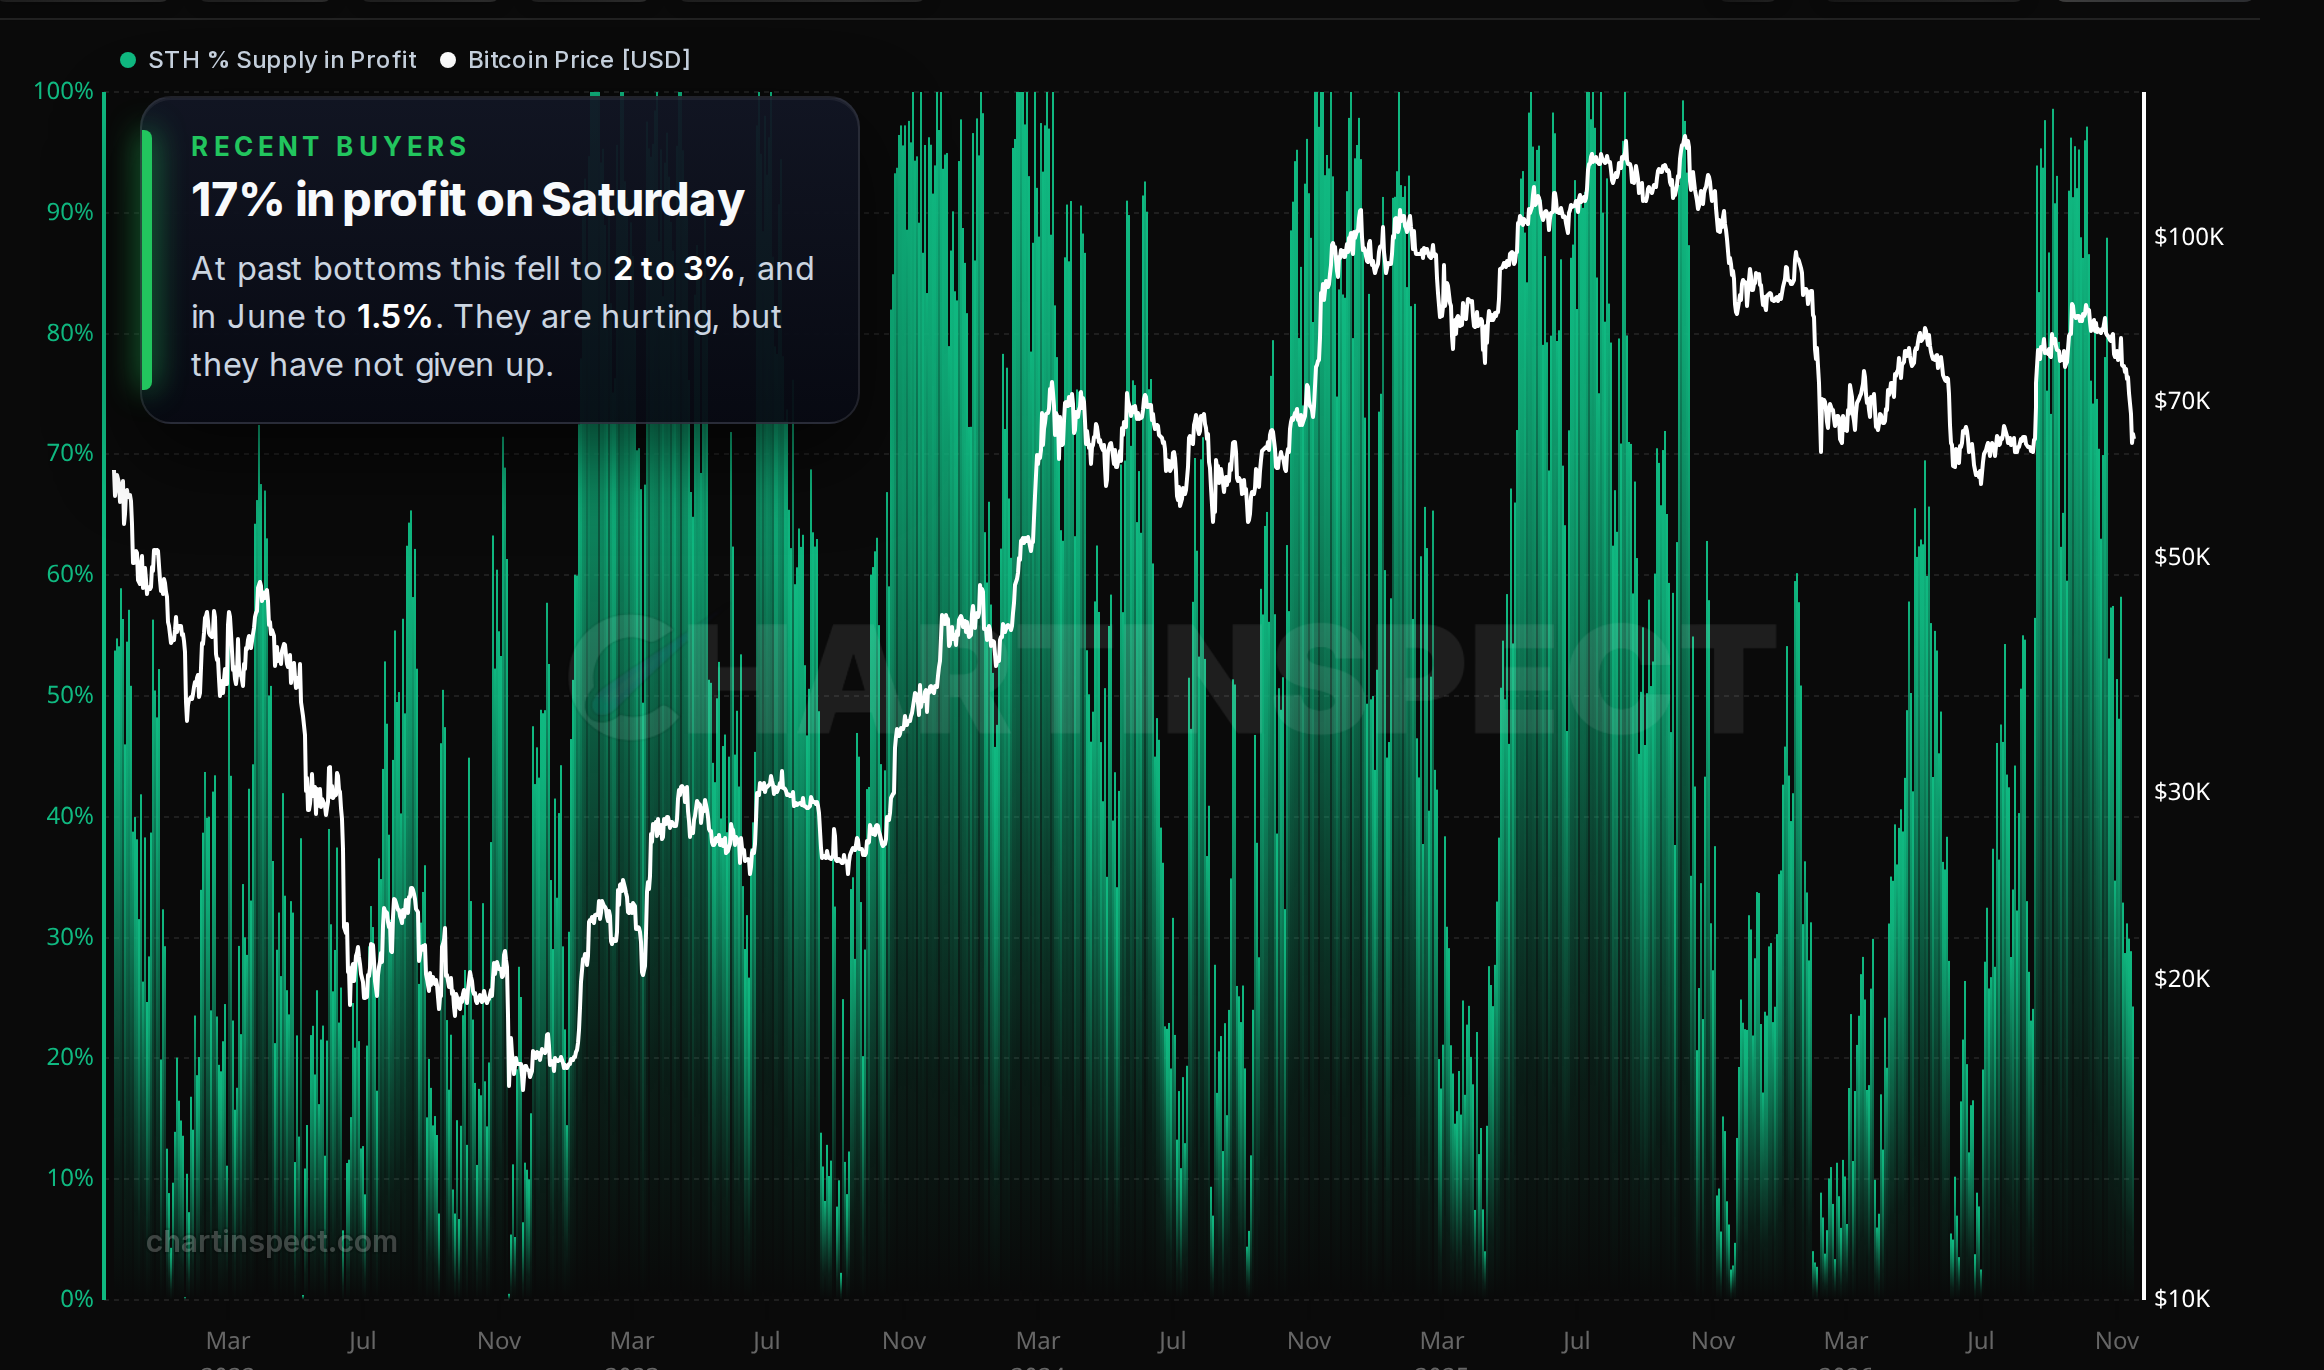
It's the same picture for recent buyers. On Saturday 17% of short-term holder coins were in profit. At past bottoms that number was 2 to 3%, and in June it was 1.5%. Two weeks ago, above both cost basis lines, I read that low stress as a good sign. Below them I read it differently. Holders who haven't given up yet are coins that can still be sold, so the next few weeks can be rough.
Bitcoin is below what it costs to mine
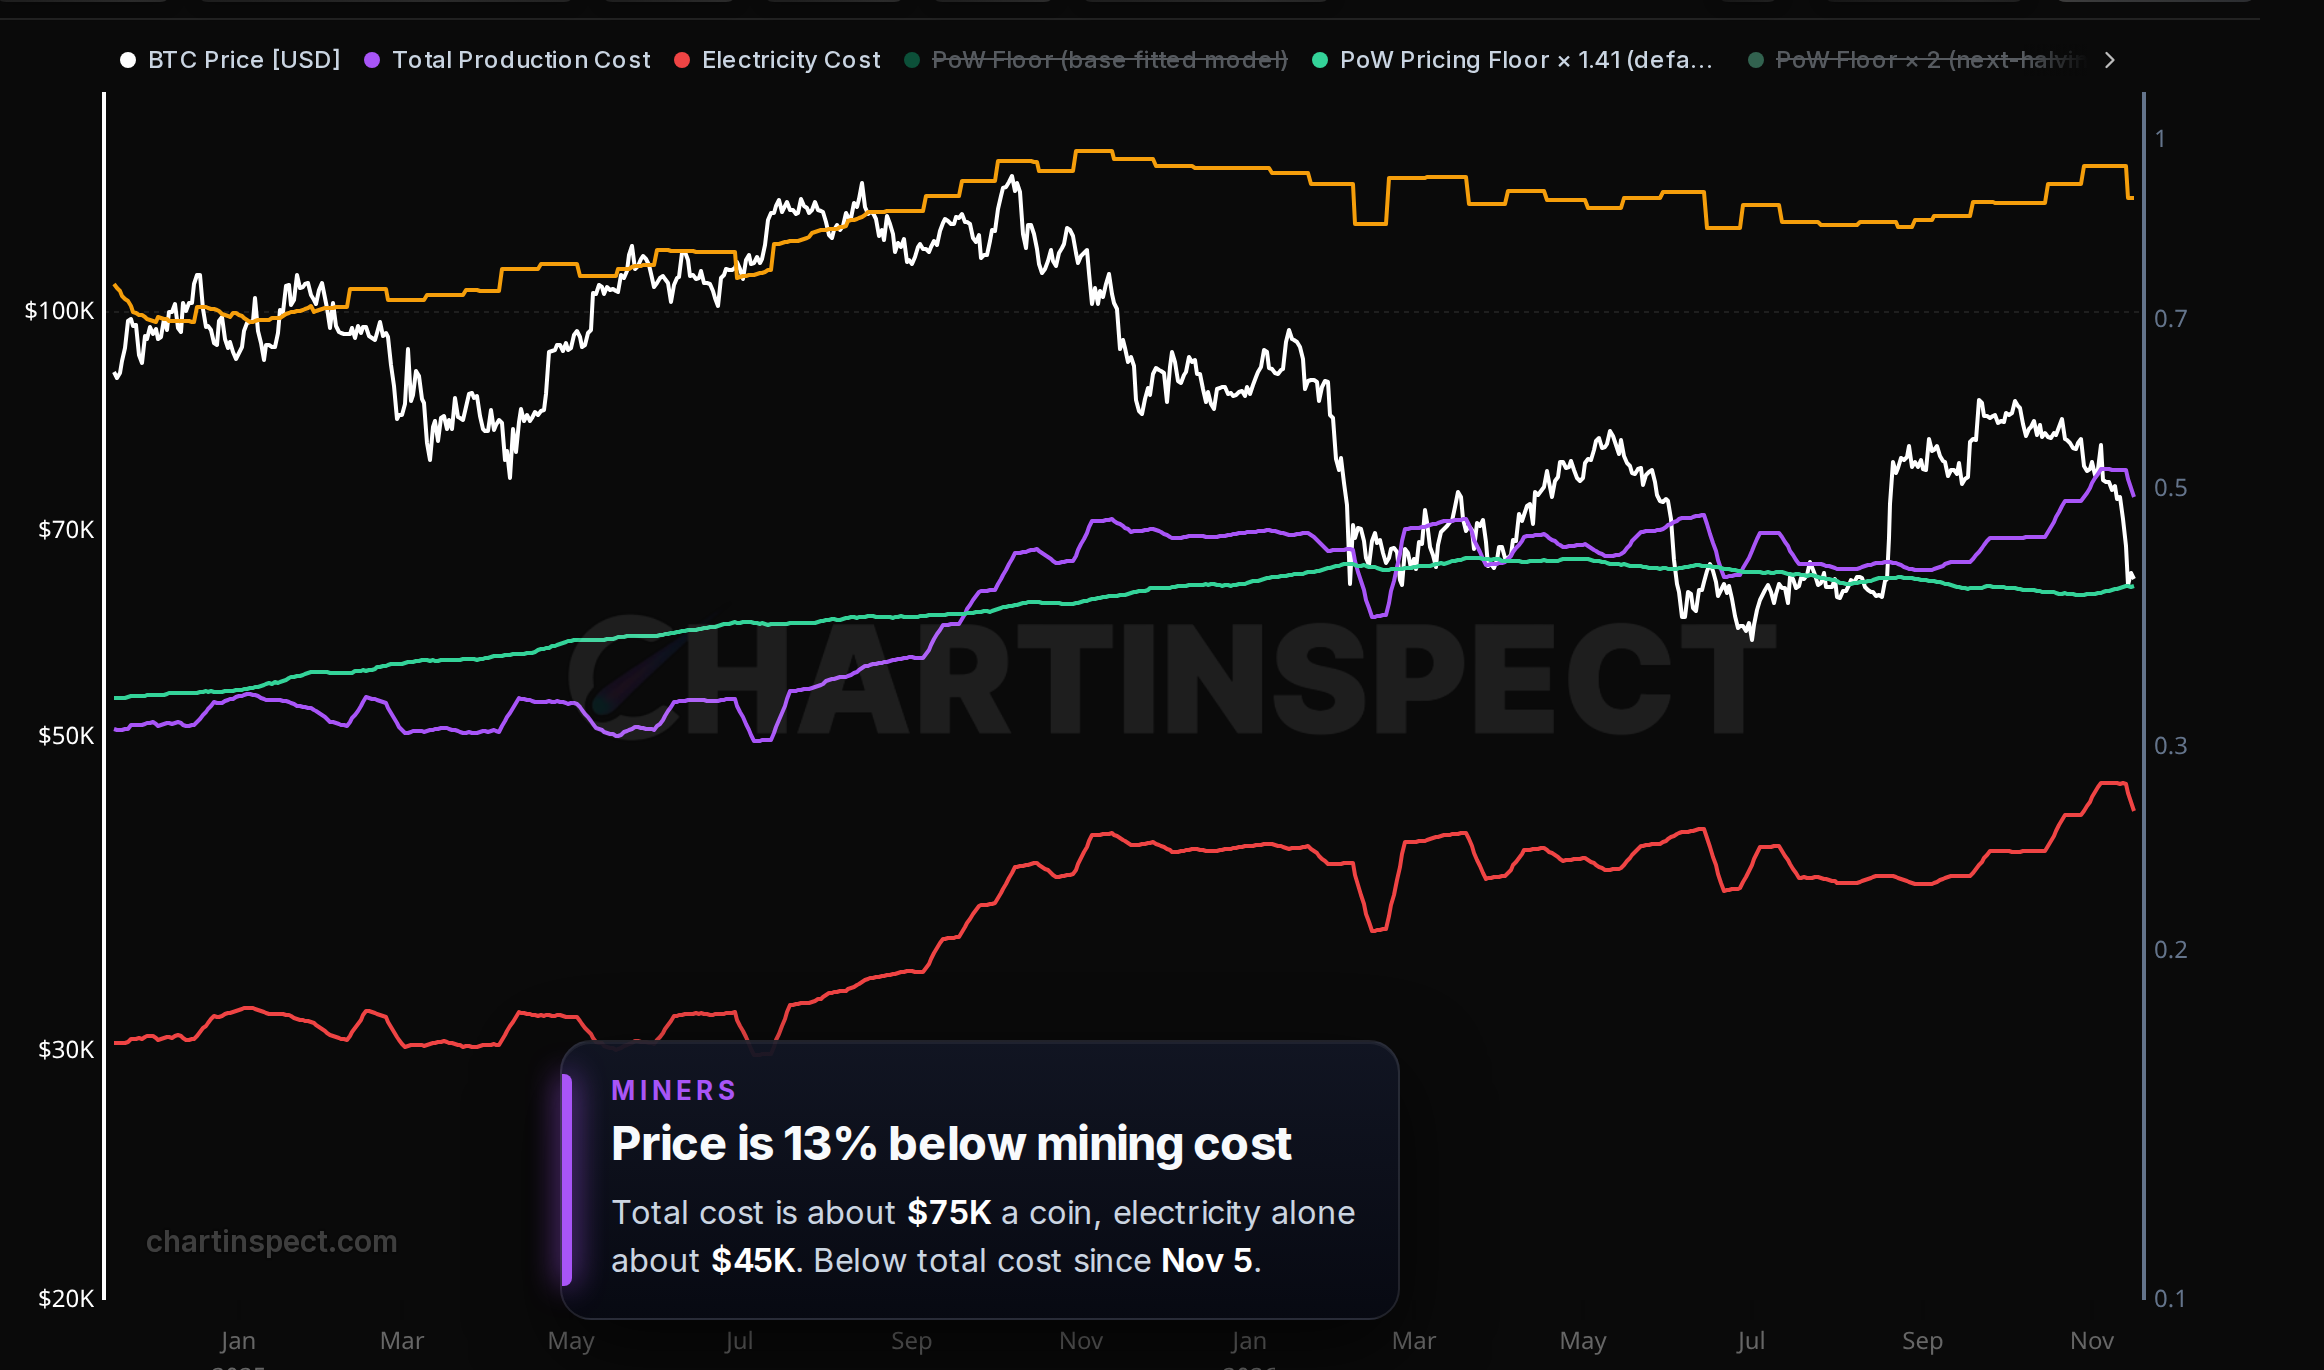
The estimated total cost to produce one Bitcoin is about $75,000, and price is about 13% under that. Miners are still well above their electricity cost, which is about $45,000, so they aren't being forced to switch off. The last long stretch below total cost was June to the middle of August, which was the accumulation zone before the move to $86,000. I think it's a reason to pay attention down here, but it's not a buy signal on its own.
Exchanges and leverage
Exchange balances are up about 10,600 BTC over the last 30 days, which is coins being sent in to sell. Inside that, about 9,400 BTC left over the weekend, right as price hit the low. Two days isn't a trend, but coins leaving on the dip is what you want to see.
Leverage is the part I like least. Around $1.2 billion of long positions were liquidated on Friday and Saturday, but futures open interest is about 647,000 BTC, almost exactly where it was a month ago, and about three in four accounts are still long. The leverage hasn't been cleared out yet.
What could prove me wrong
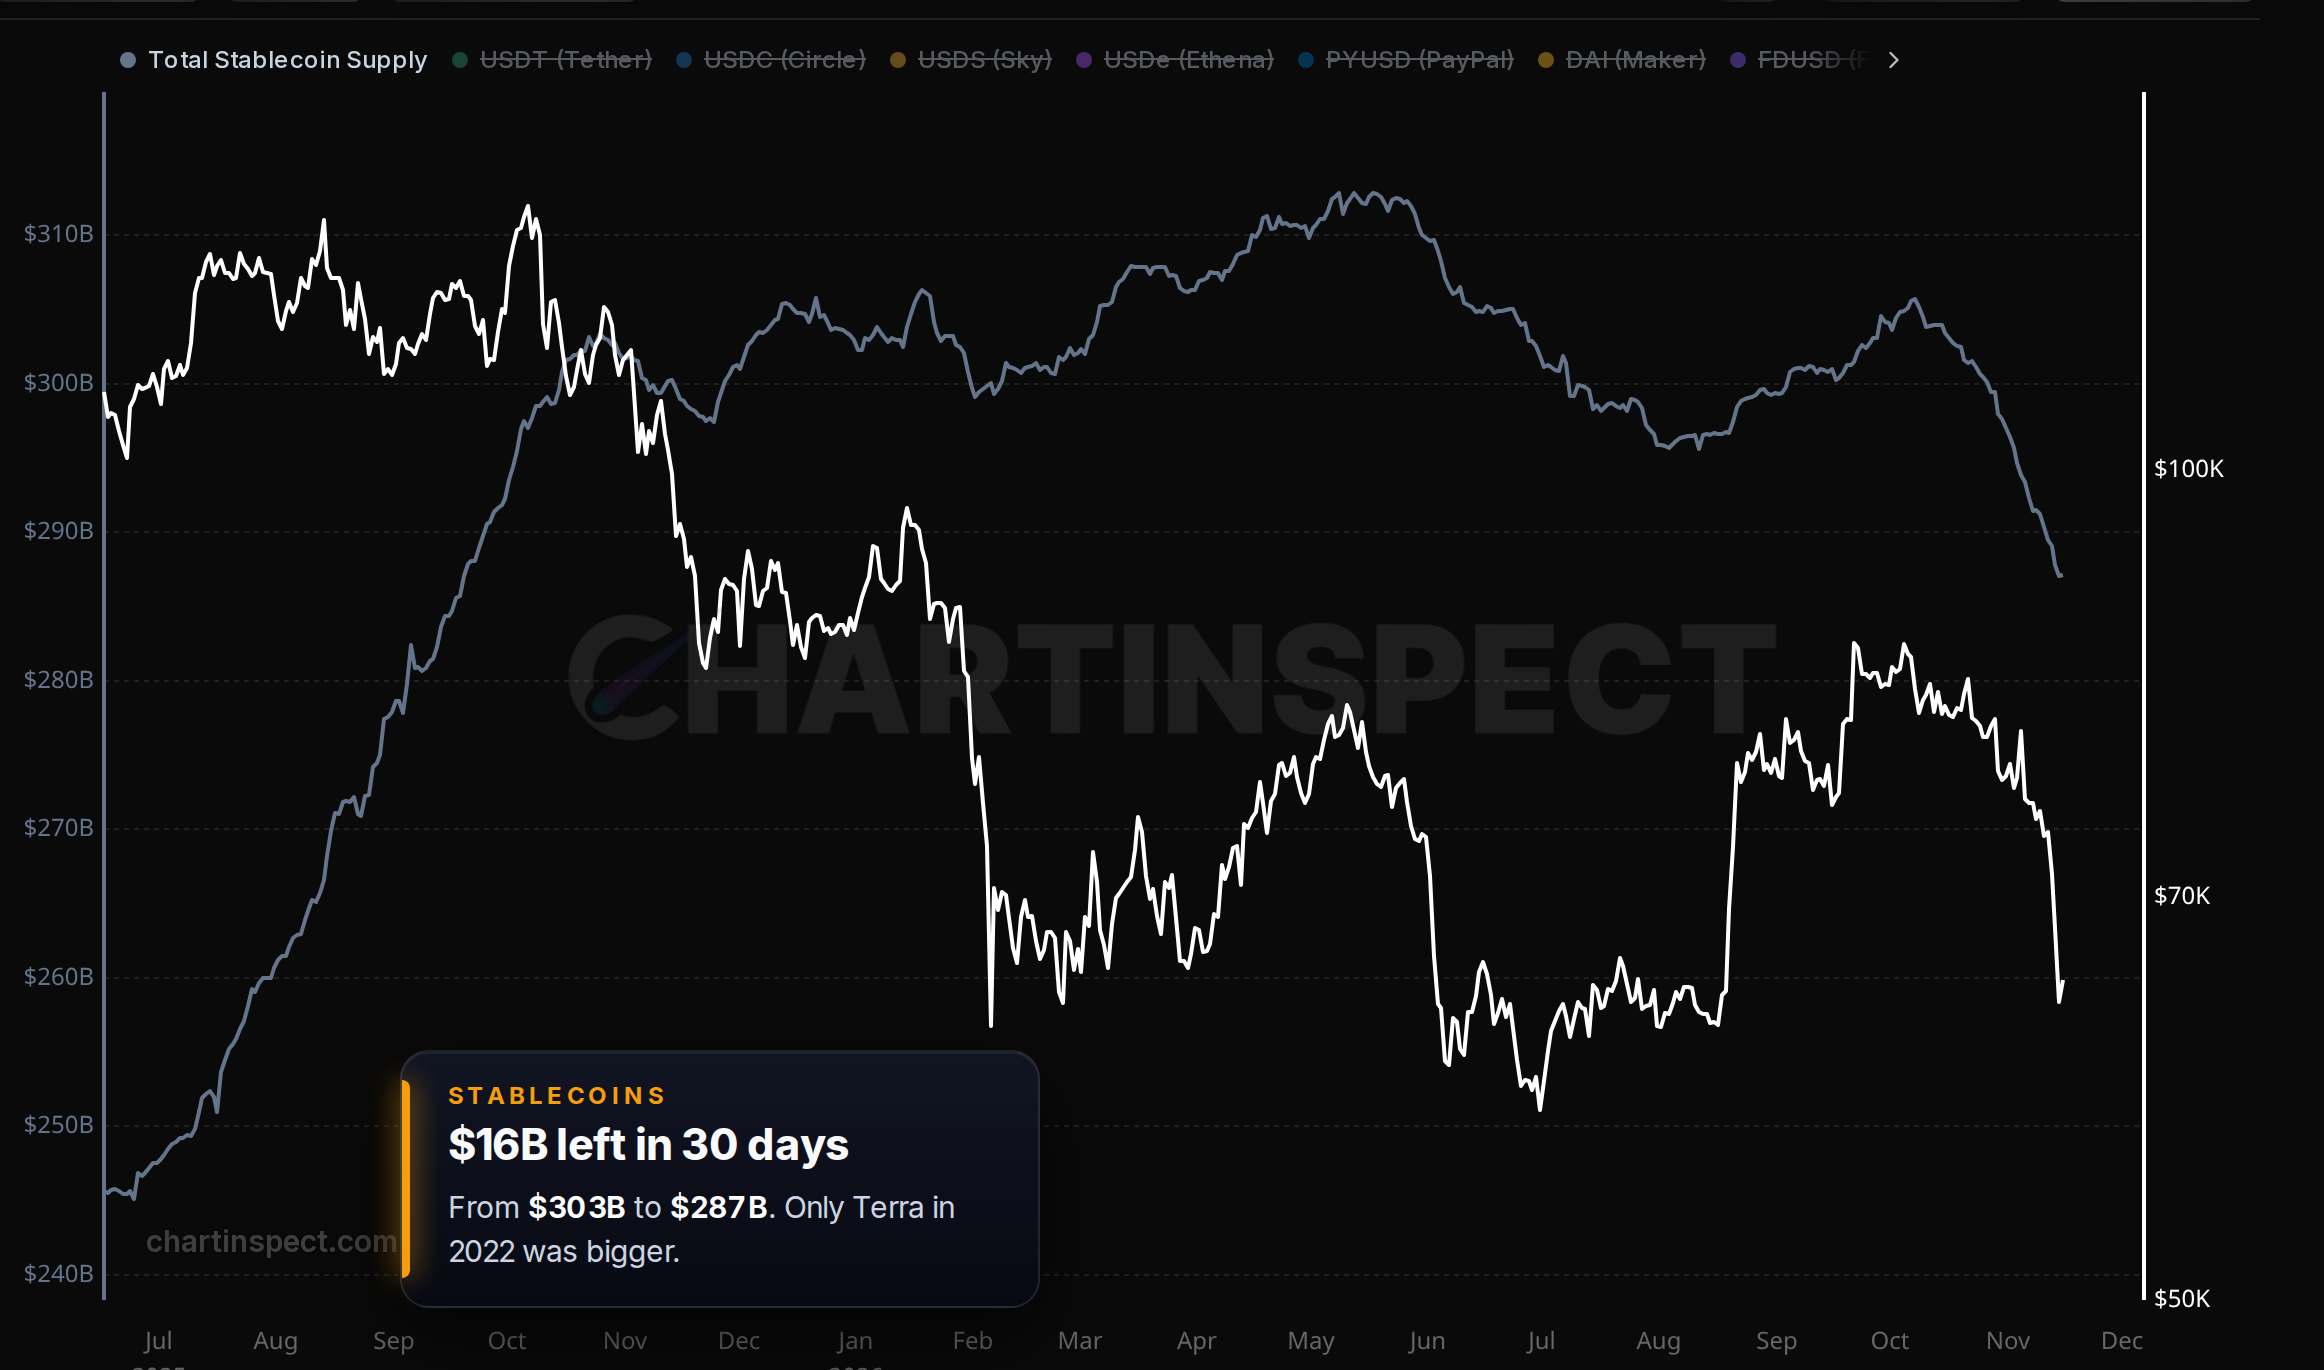
Cash. Stablecoin supply fell from about $303 billion to $287 billion in 30 days. The only bigger drop on record was Terra in 2022. A dip only gets bought if there's cash waiting to buy it.
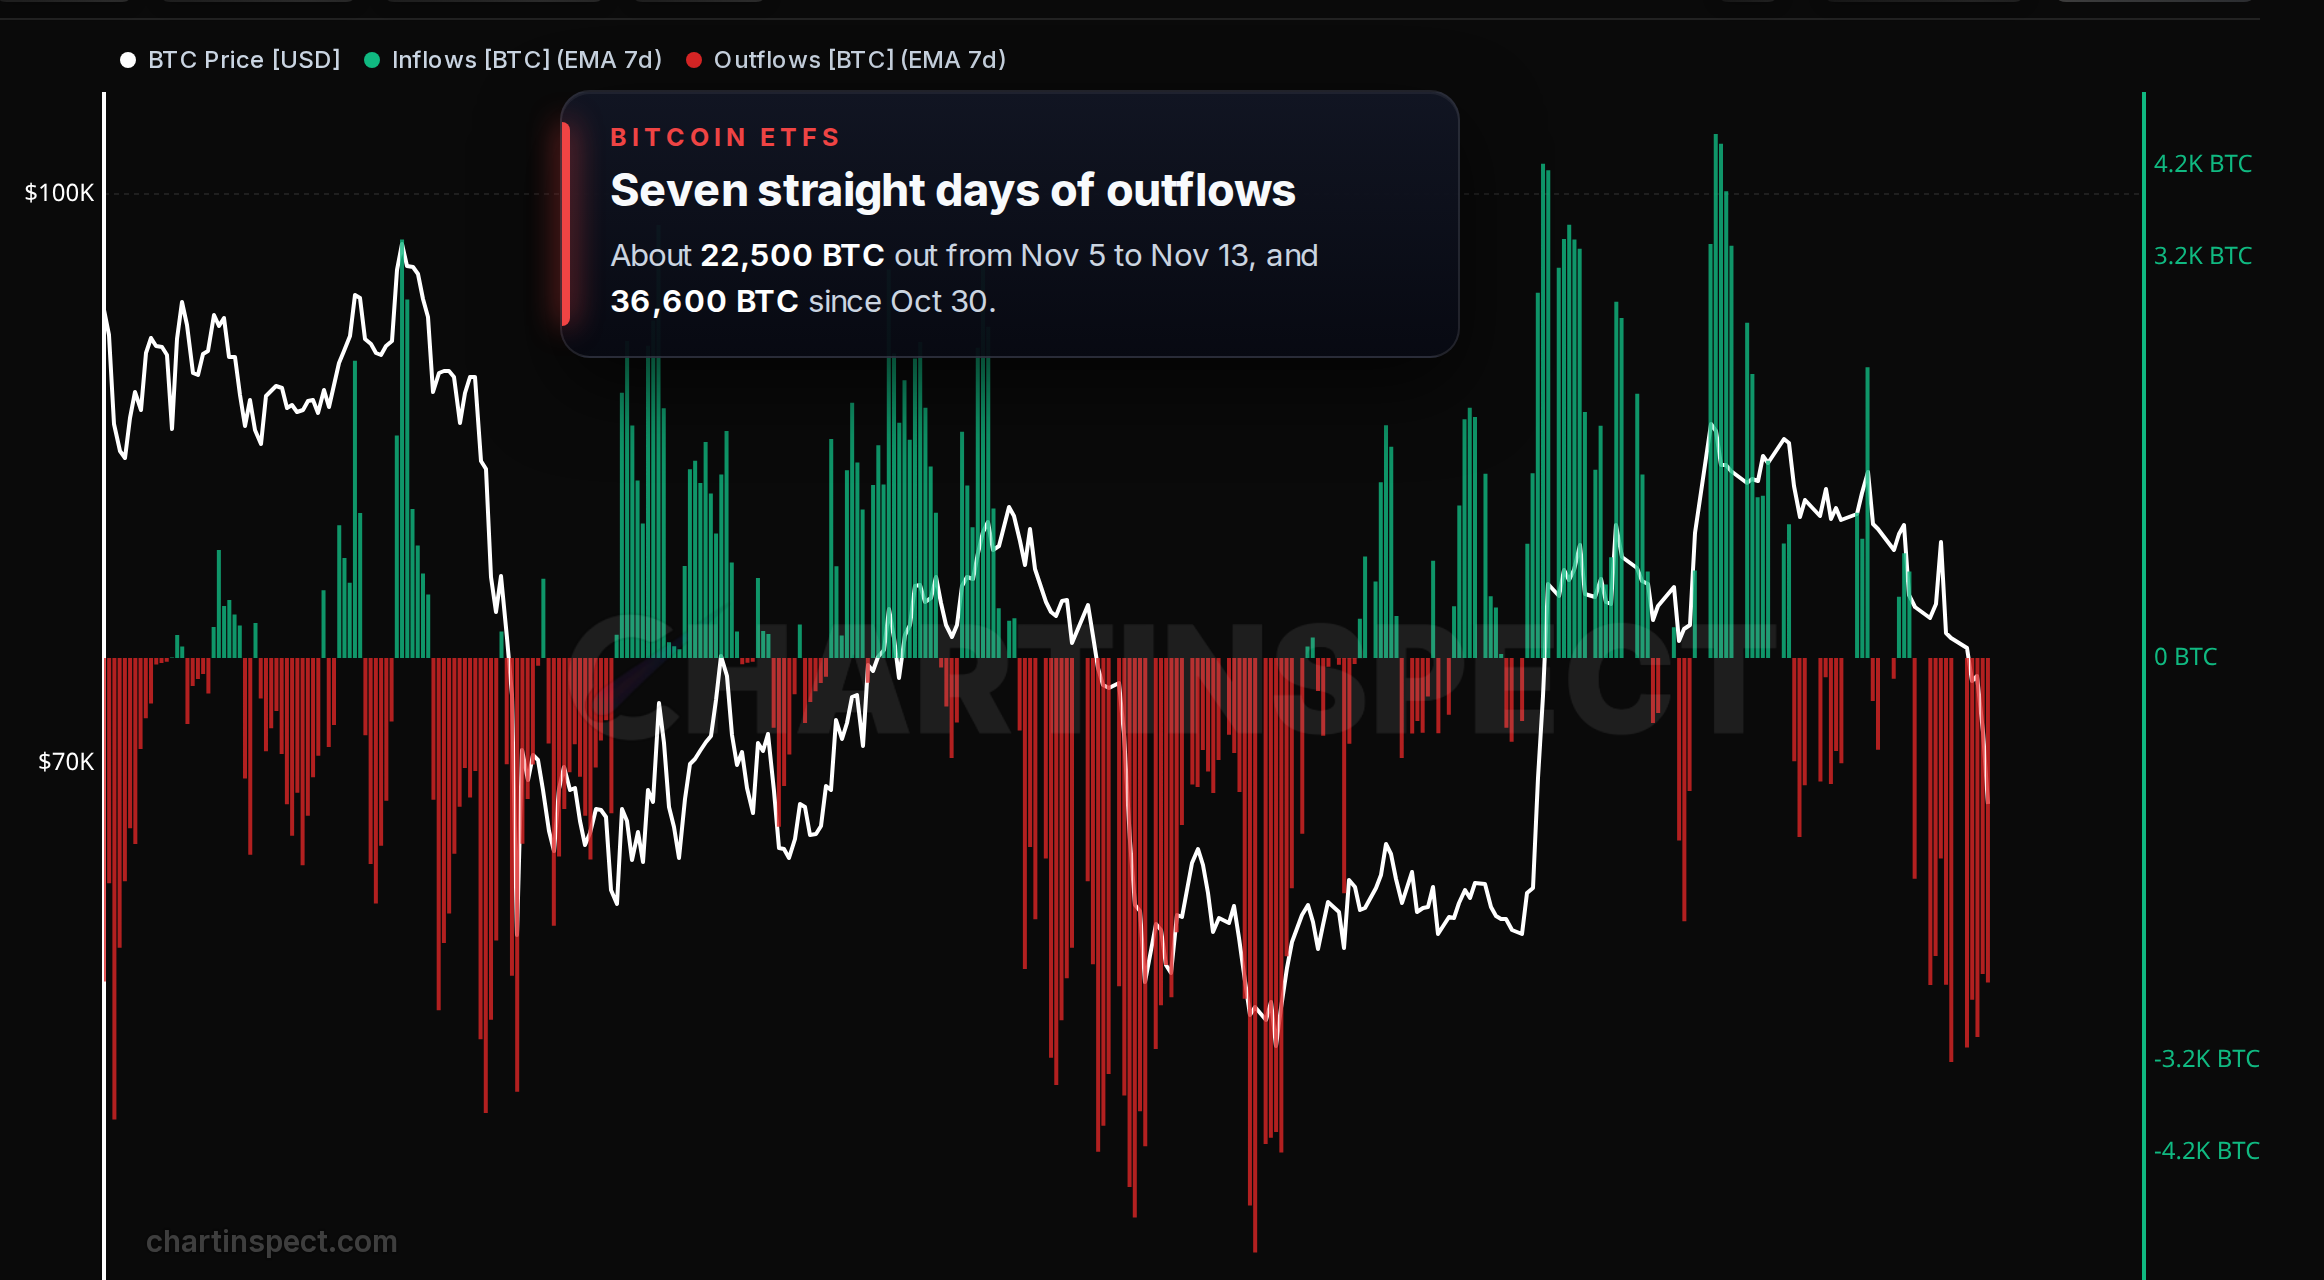
The ETFs. US Bitcoin ETFs had seven straight days of outflows through Friday, and they've sold about 36,600 BTC since October 30. That selling needs to slow down before price can really turn.
Macro. If Nvidia's earnings disappoint on Tuesday, or the Fed raises rates on December 9 and stocks keep falling, Bitcoin won't hold up on its own. Everything in this letter is barring a broader macroeconomic downturn.
My take
Two weeks ago I called the median cost basis the line Bitcoin can't lose, and I said I'd take weeks below it seriously. Bitcoin closed last week at $65,315, about 1% under it. That's the first weekly close below it since August, so the first thing I want to see is Bitcoin back above about $66,000.
In my opinion Bitcoin and Ethereum are both undervalued here, and the people who were waiting for lower prices have a second chance at them. I think this could very well be a higher low somewhere around $60,000 to $62,000, without Bitcoin going considerably lower. I can't tell you this is the exact bottom. The selling isn't finished by the usual measures, cash is leaving, and the leverage is still there. Barring a broader macroeconomic downturn, I don't think this is a bad place to be buying, a little at a time.
If Bitcoin closes below $58,625, there's no higher low and I'll change this view.
Every chart in this letter is on ChartInspect. The on-chain data updates every 10 minutes from our own indexers. Some of the charts I used here, like the Ethereum ones, are Pro, which is $29.99 a month, or $249 a year, which works out to about 31% off.
Thanks for reading,
Tristan
Enjoyed this article?
Subscribe to get the latest research in your inbox.
Comments
Sign in to join the discussion.