The Shrinking Cycle
I backtested 17 Bitcoin top models from the 2022 low and six landed within 10% of the 2025 top. Here's the math behind them, the ones that failed, and what would tell me the $149K to $185K range is wrong.

In this week's video I tested 17 models against the last Bitcoin cycle to see which ones would have called the 2025 top. Six of them got within 10%. In this letter I'll go through what each of those six is actually measuring, how I tested them, and then a few things I didn't have time for in the video, including a chart on long-term holder selling and a closer look at Ethereum.
All of this comes from the Cycle Top Screener, which is free and updates every day. As I write this on October 26, 2026, Bitcoin is at $80,584. The realized price, which is roughly what the average coin last cost, is $54,104, and MVRV is 1.49.
The short version

| Model | Next top | Backtest miss |
|---|---|---|
| Power law | $149K | -1.1% |
| Top to top, inflation-adjusted | $169K | +3.2% |
| True Market Mean × ratio | $179K | +4.3% |
| Realized price × MVRV | $170K | -5.9% |
| Top to top in US M2 | $185K | -6.1% |
| Top to top (USD) | $166K | -6.7% |
That's a range of $149K to $185K, a median of $170K, and a window of May to September 2029.
The six models
They all work the same basic way. Each one takes something that grows every cycle, measures how much less it grew each time, and assumes that keeps happening one more time.
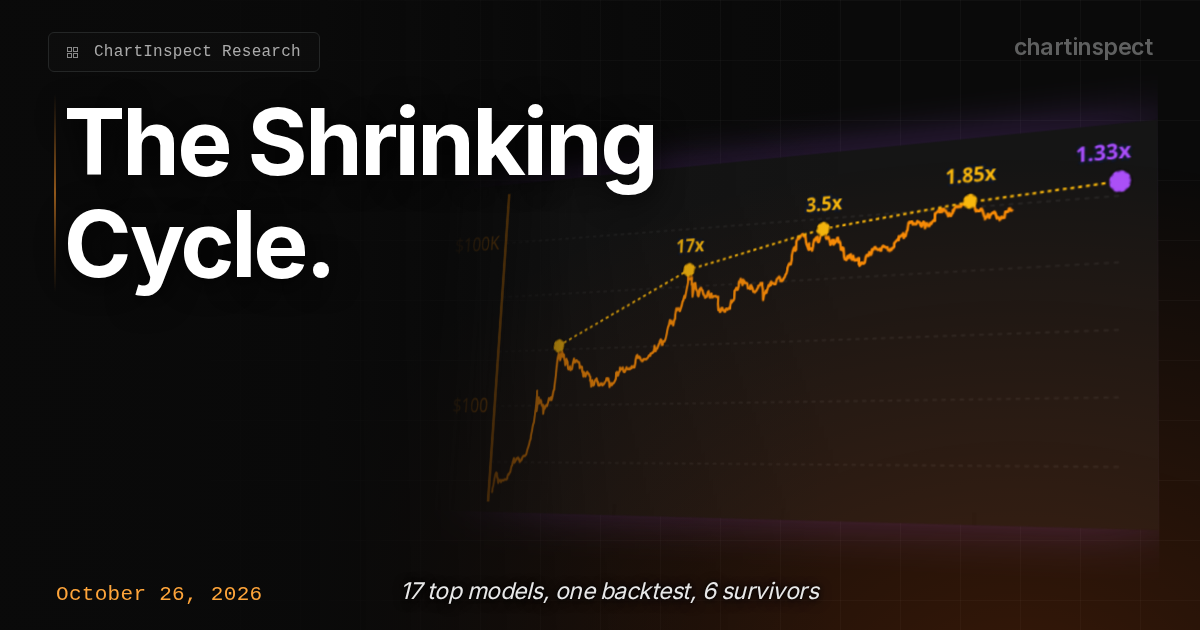
Top to top: $166K. Each top as a multiple of the one before went 16.9x, 3.46x, 1.85x. The growth keeps shrinking at a steady rate, and one more step gives about 1.33x the 2025 top.
Top to top, adjusted for inflation: $169K. Same idea, but with every price converted into today's dollars first. Even after inflation, every top was higher than the last ($1,661, $26,515, $81,416, $129,351). The next one comes out at $156K in today's dollars, which is $169K by 2029 at current inflation.
Top to top in US M2: $185K. Same idea again, with price measured against the US money supply instead of CPI. This is the top of the range.
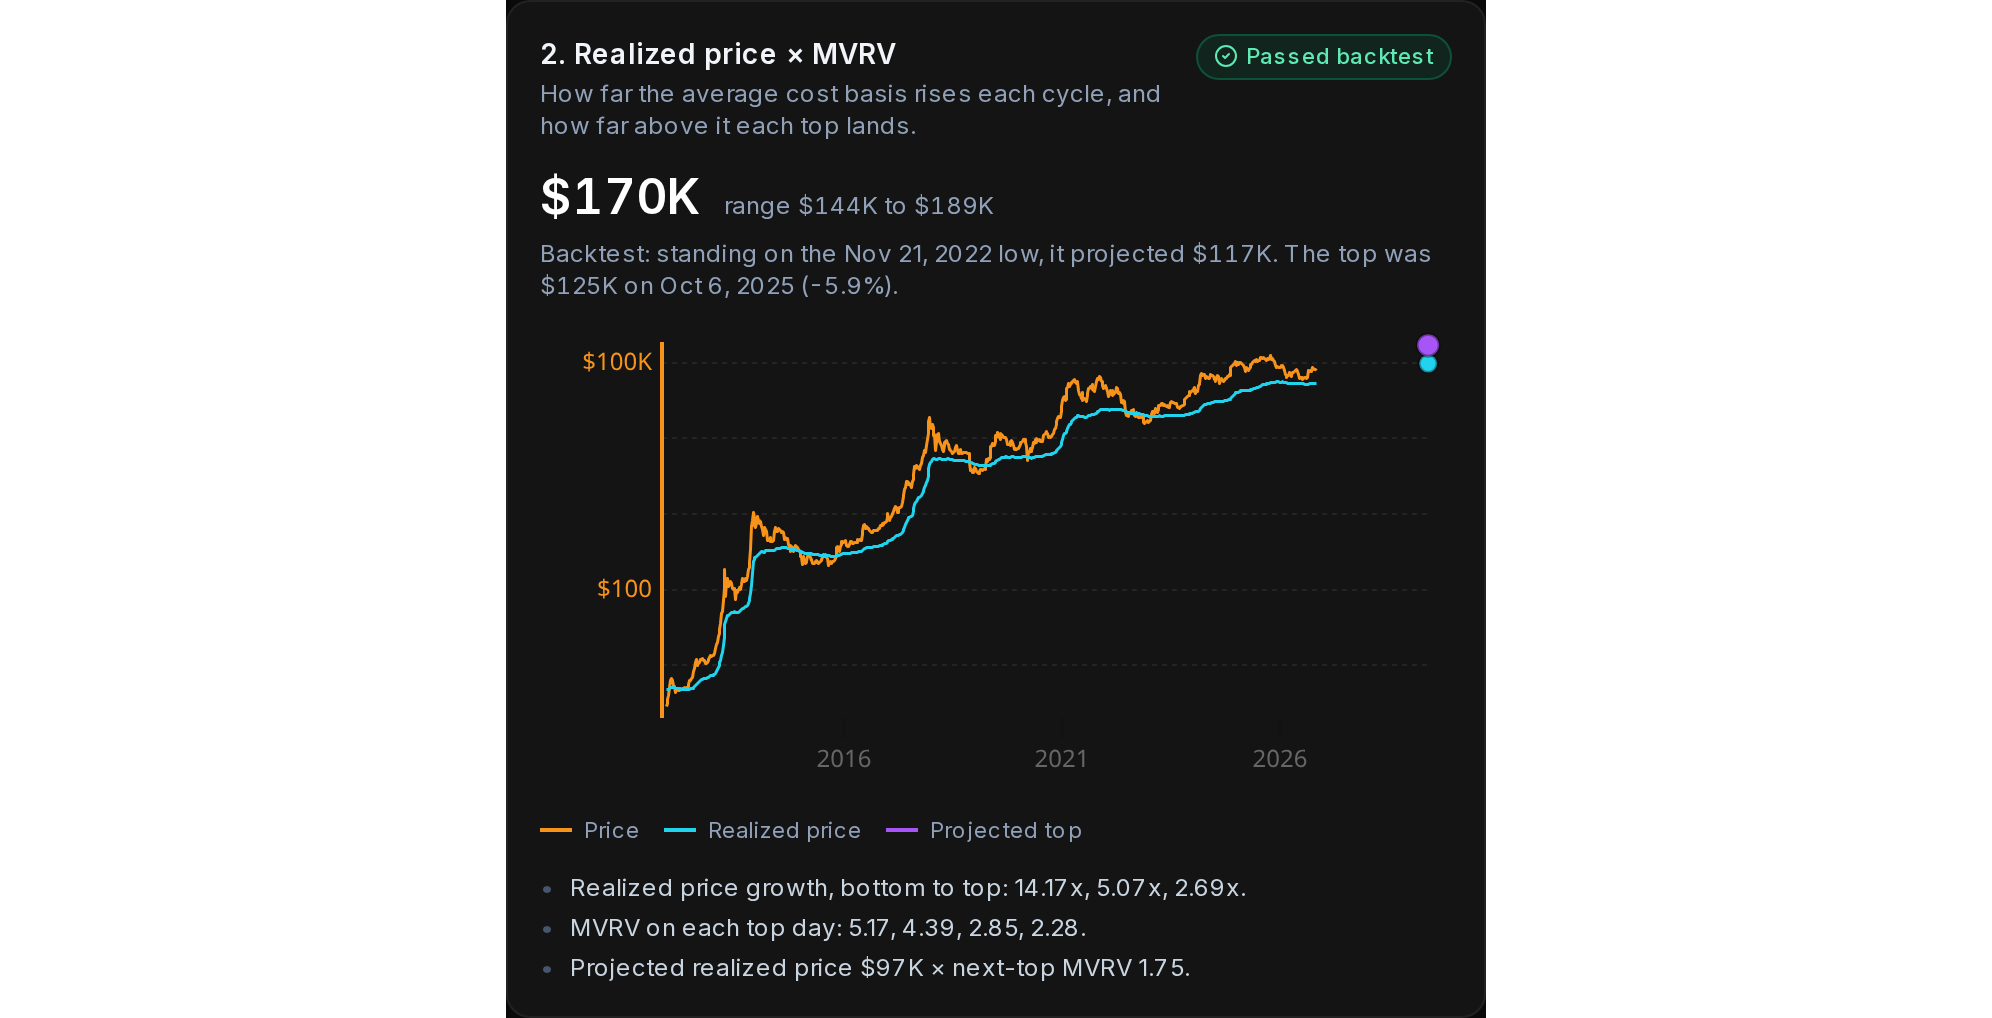
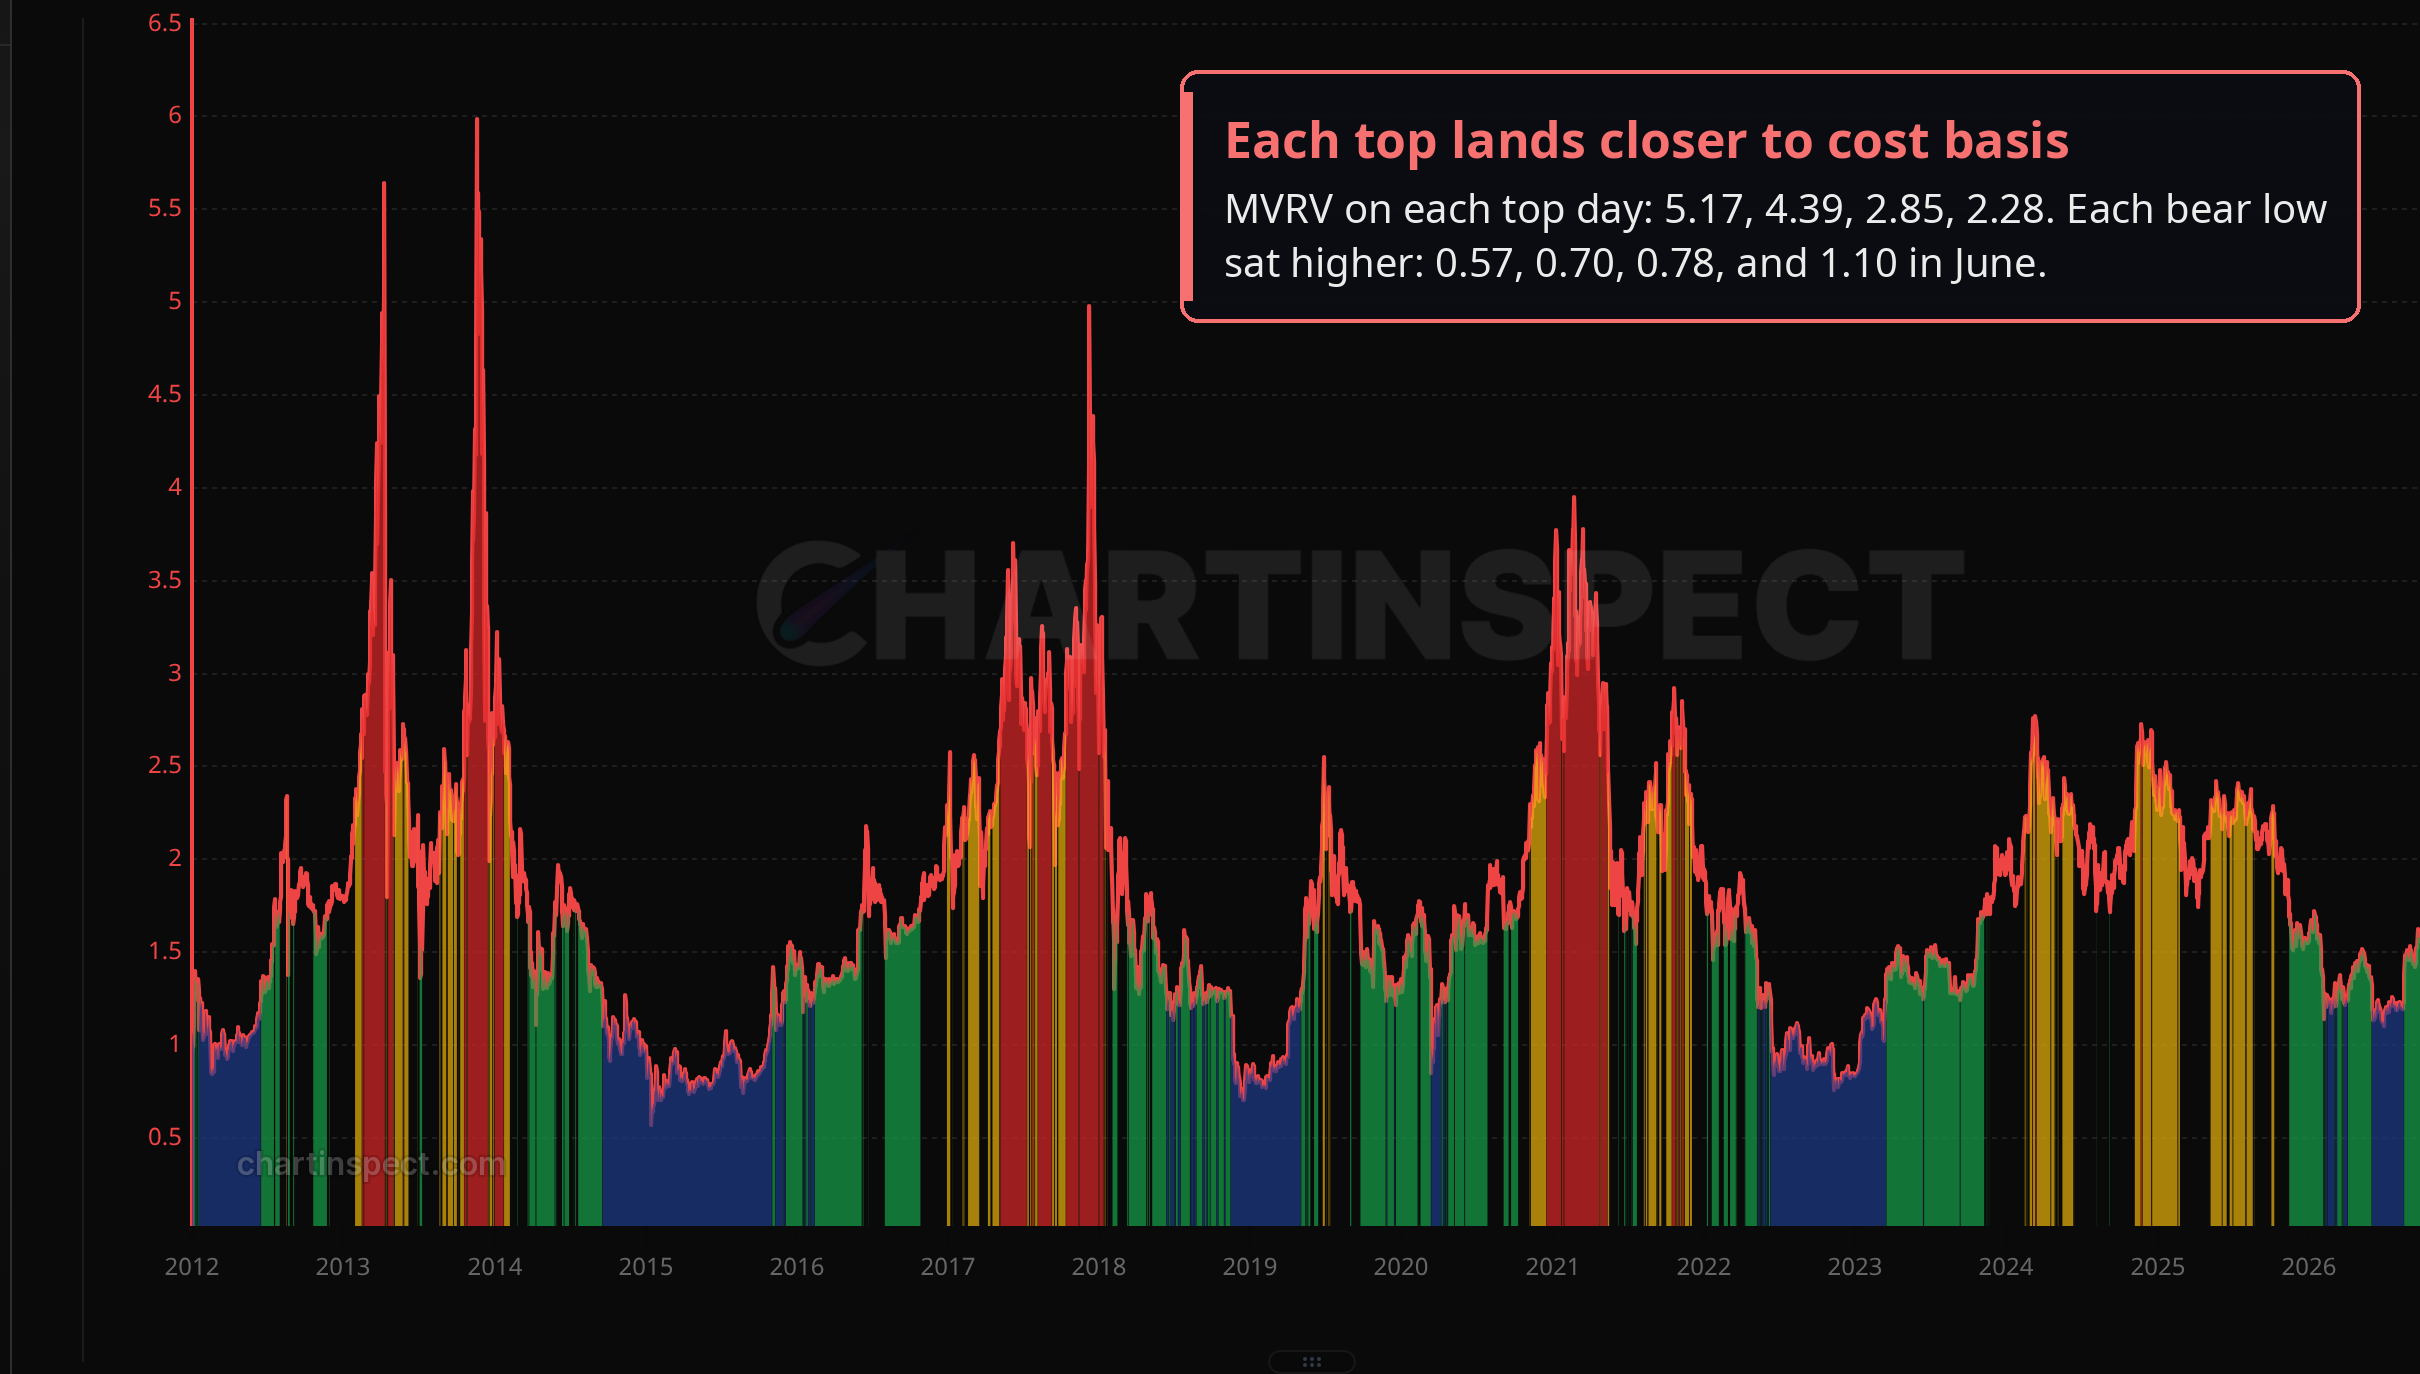
Realized price × MVRV: $170K. This one splits the top into two parts. The realized price grew 14.2x, 5.1x and 2.7x from each bottom to the next top, which points to about $97K at the next top. MVRV at each top has been falling too (5.17, 4.39, 2.85, 2.28), which points to about 1.75 next time. $97K × 1.75 is $170K. This is the one I trust the most, because the realized price has been shrinking at almost exactly the same rate every cycle.
True Market Mean × ratio: $179K. Same split as above, using the True Market Mean as the cost basis. It leaves out coins that have been sitting untouched for years, so it's closer to what active investors paid.
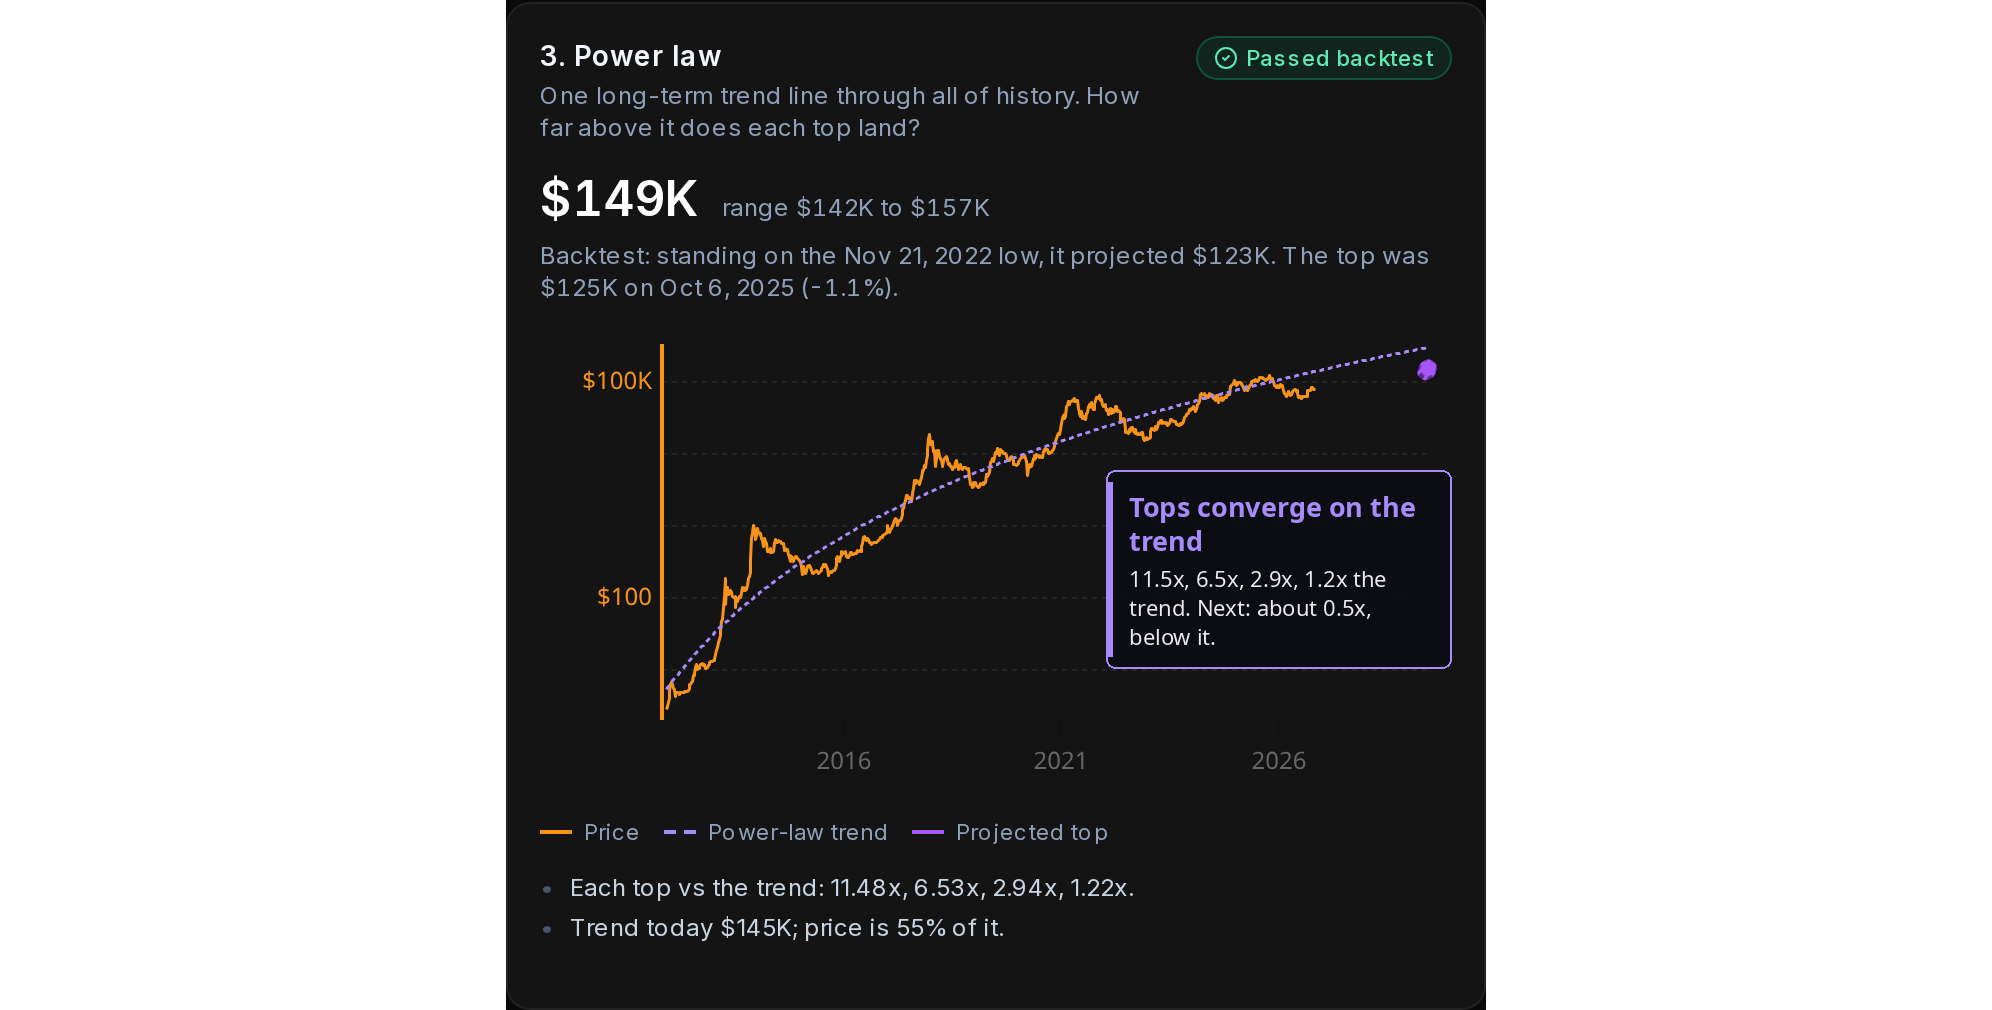
Power law: $149K. This one draws a single trend line through all of Bitcoin's history and looks at how far above it each top got: 11.5x, 6.5x, 2.9x, then 1.2x. Following that pattern, the next top lands at about half the trend, which is $149K. It had the best backtest of all 17, missing the 2025 top by just 1.1%. It's also the only model that puts the next top below its own trend line, so I see it as the floor of the range.
Two things stand out to me across all six. First, smaller cycles don't mean Bitcoin is losing to inflation. $170K in 2029 is still about 9% a year from the last top, roughly 5.6% a year ahead of CPI. Second, the realized price model says this top could be the calmest one yet. If you're waiting for it to feel like 2021 before taking profit, that moment might never come.
How I tested them
Almost any model can fit three past cycles, so fitting history doesn't tell me much. Instead I re-ran every model as if it were November 21, 2022, the last bear market bottom, using only data up to that day. Then I checked how close it got to the real top of $124,715 in October 2025. Within 25% counts as a pass, and within 10% gets a model into the range above. There's a test in the code that changes every data point after the 2022 bottom and makes sure the prediction stays exactly the same, so none of them can sneak a look at the future.
The tops and bottoms are found by a fixed rule rather than by hand. A top is the highest daily close in the 30 months after a halving, and a bottom is the lowest close between two tops. That gives this cycle's low as $58,625 on June 30, 2026.
What didn't work
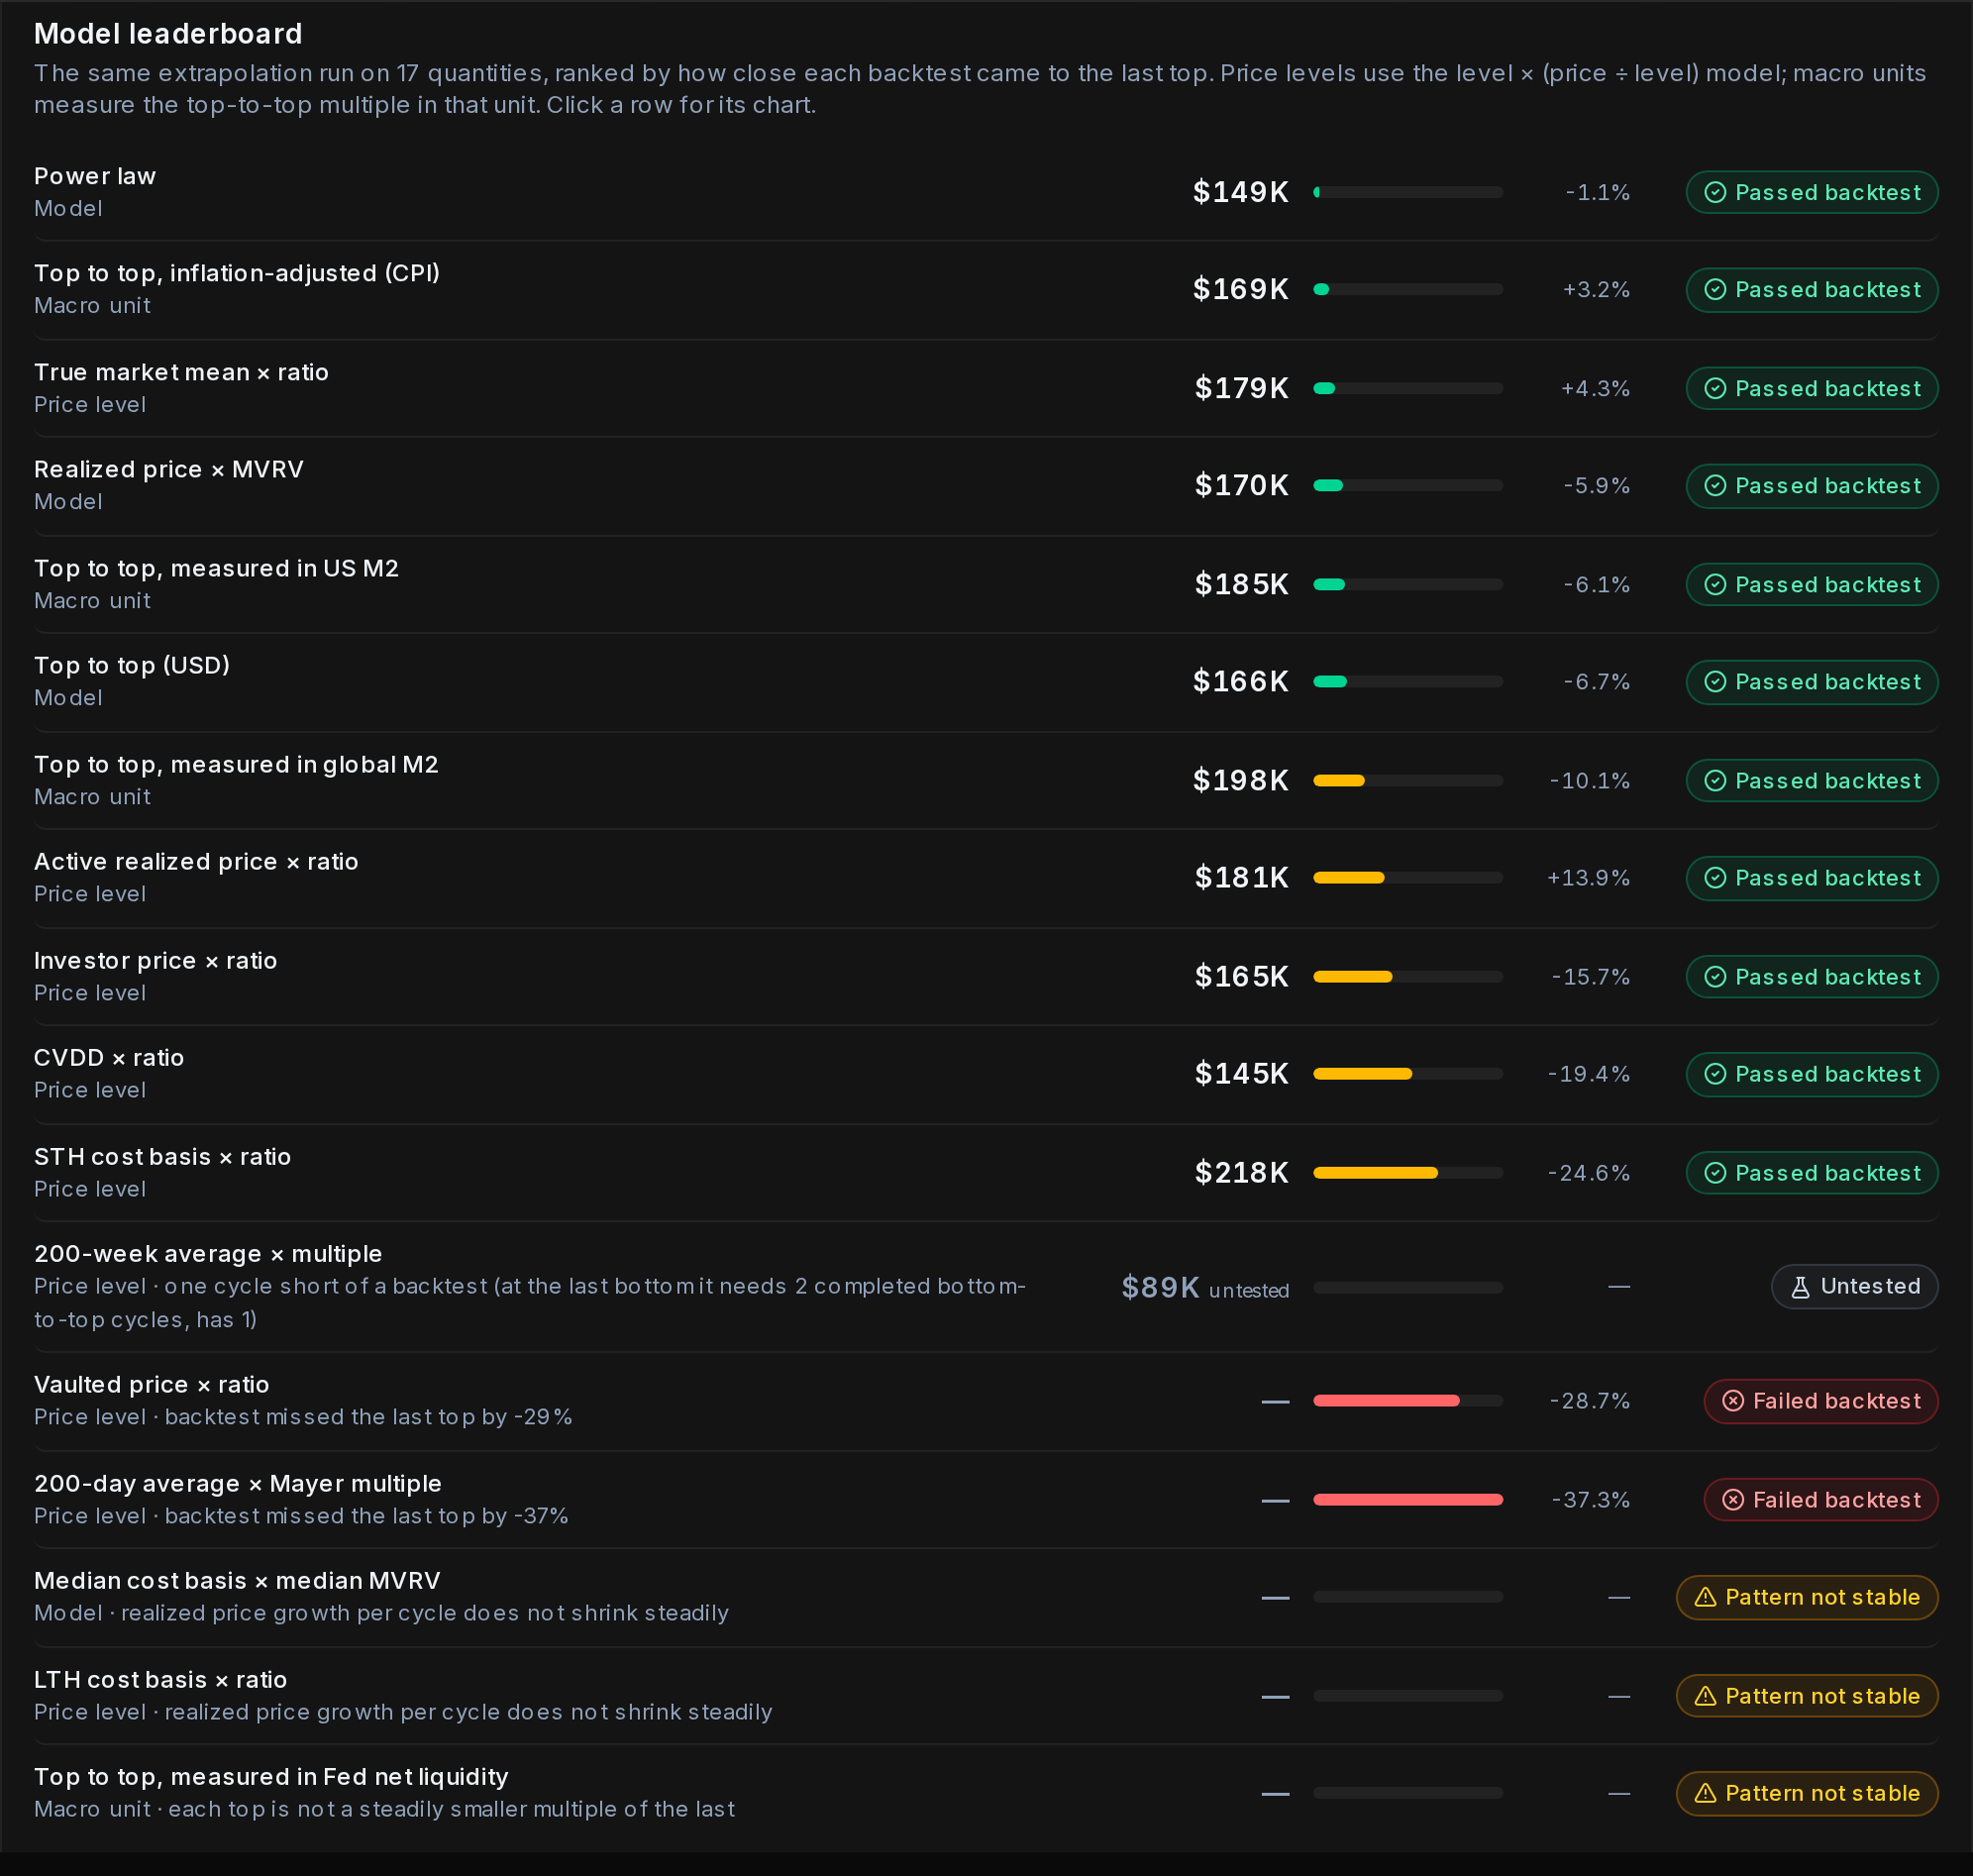
The 200-day average with the Mayer multiple missed by 37%, and the vaulted price missed by 29%. The median cost basis, the long-term holder cost basis and Fed net liquidity all failed for a different reason: their growth didn't shrink every cycle, so there's no pattern to project. The 200-week average didn't have enough history at the 2022 low to be tested at all.
I think it's important to show these. Picking the best 6 out of 17 is a form of curve fitting in itself, and with only a few cycles of data, any one model could have just been lucky. What gives me more confidence is that the six that passed are built from very different inputs and still land within 25% of each other. Dropping the 2013 cycle completely barely changes them either.
When the top could come
| Counted from | Past cycles (days) | Next top |
|---|---|---|
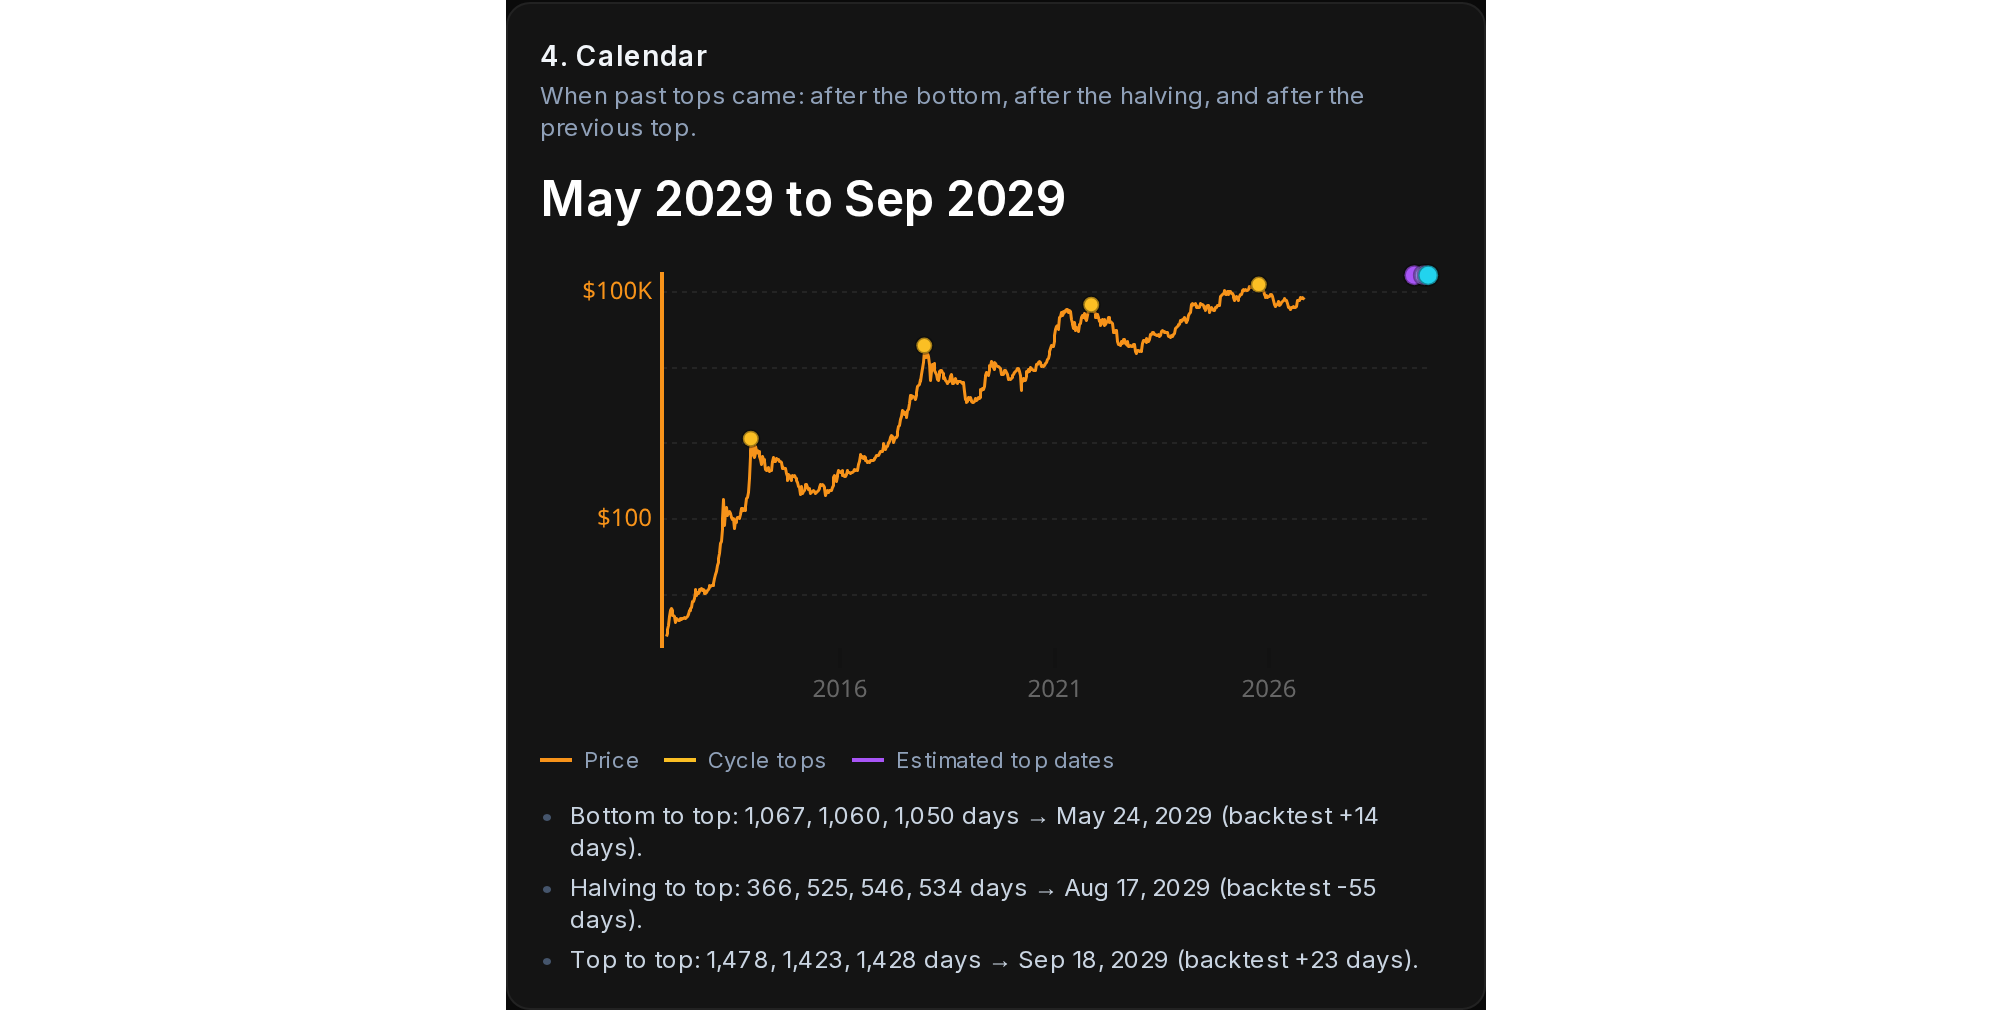
| The June 30, 2026 low | 1,067 / 1,060 / 1,050 | May 24, 2029 |
| The April 2028 halving | 366 / 525 / 546 / 534 | Aug 17, 2029 |
| The October 2025 top | 1,478 / 1,423 / 1,428 | Sep 18, 2029 |
All three passed a backtest within 90 days. Bottom to top is surprisingly consistent: the last three cycles were only 17 days apart.
There's also a checkpoint well before 2029. The first daily close above the previous top came 771, 717 and 469 days after each bottom, which puts the next new all-time high between October 2027 and August 2028. If we haven't had one by late 2028, the timeline is wrong, and I'll say so.
Long-term holders (this wasn't in the video)
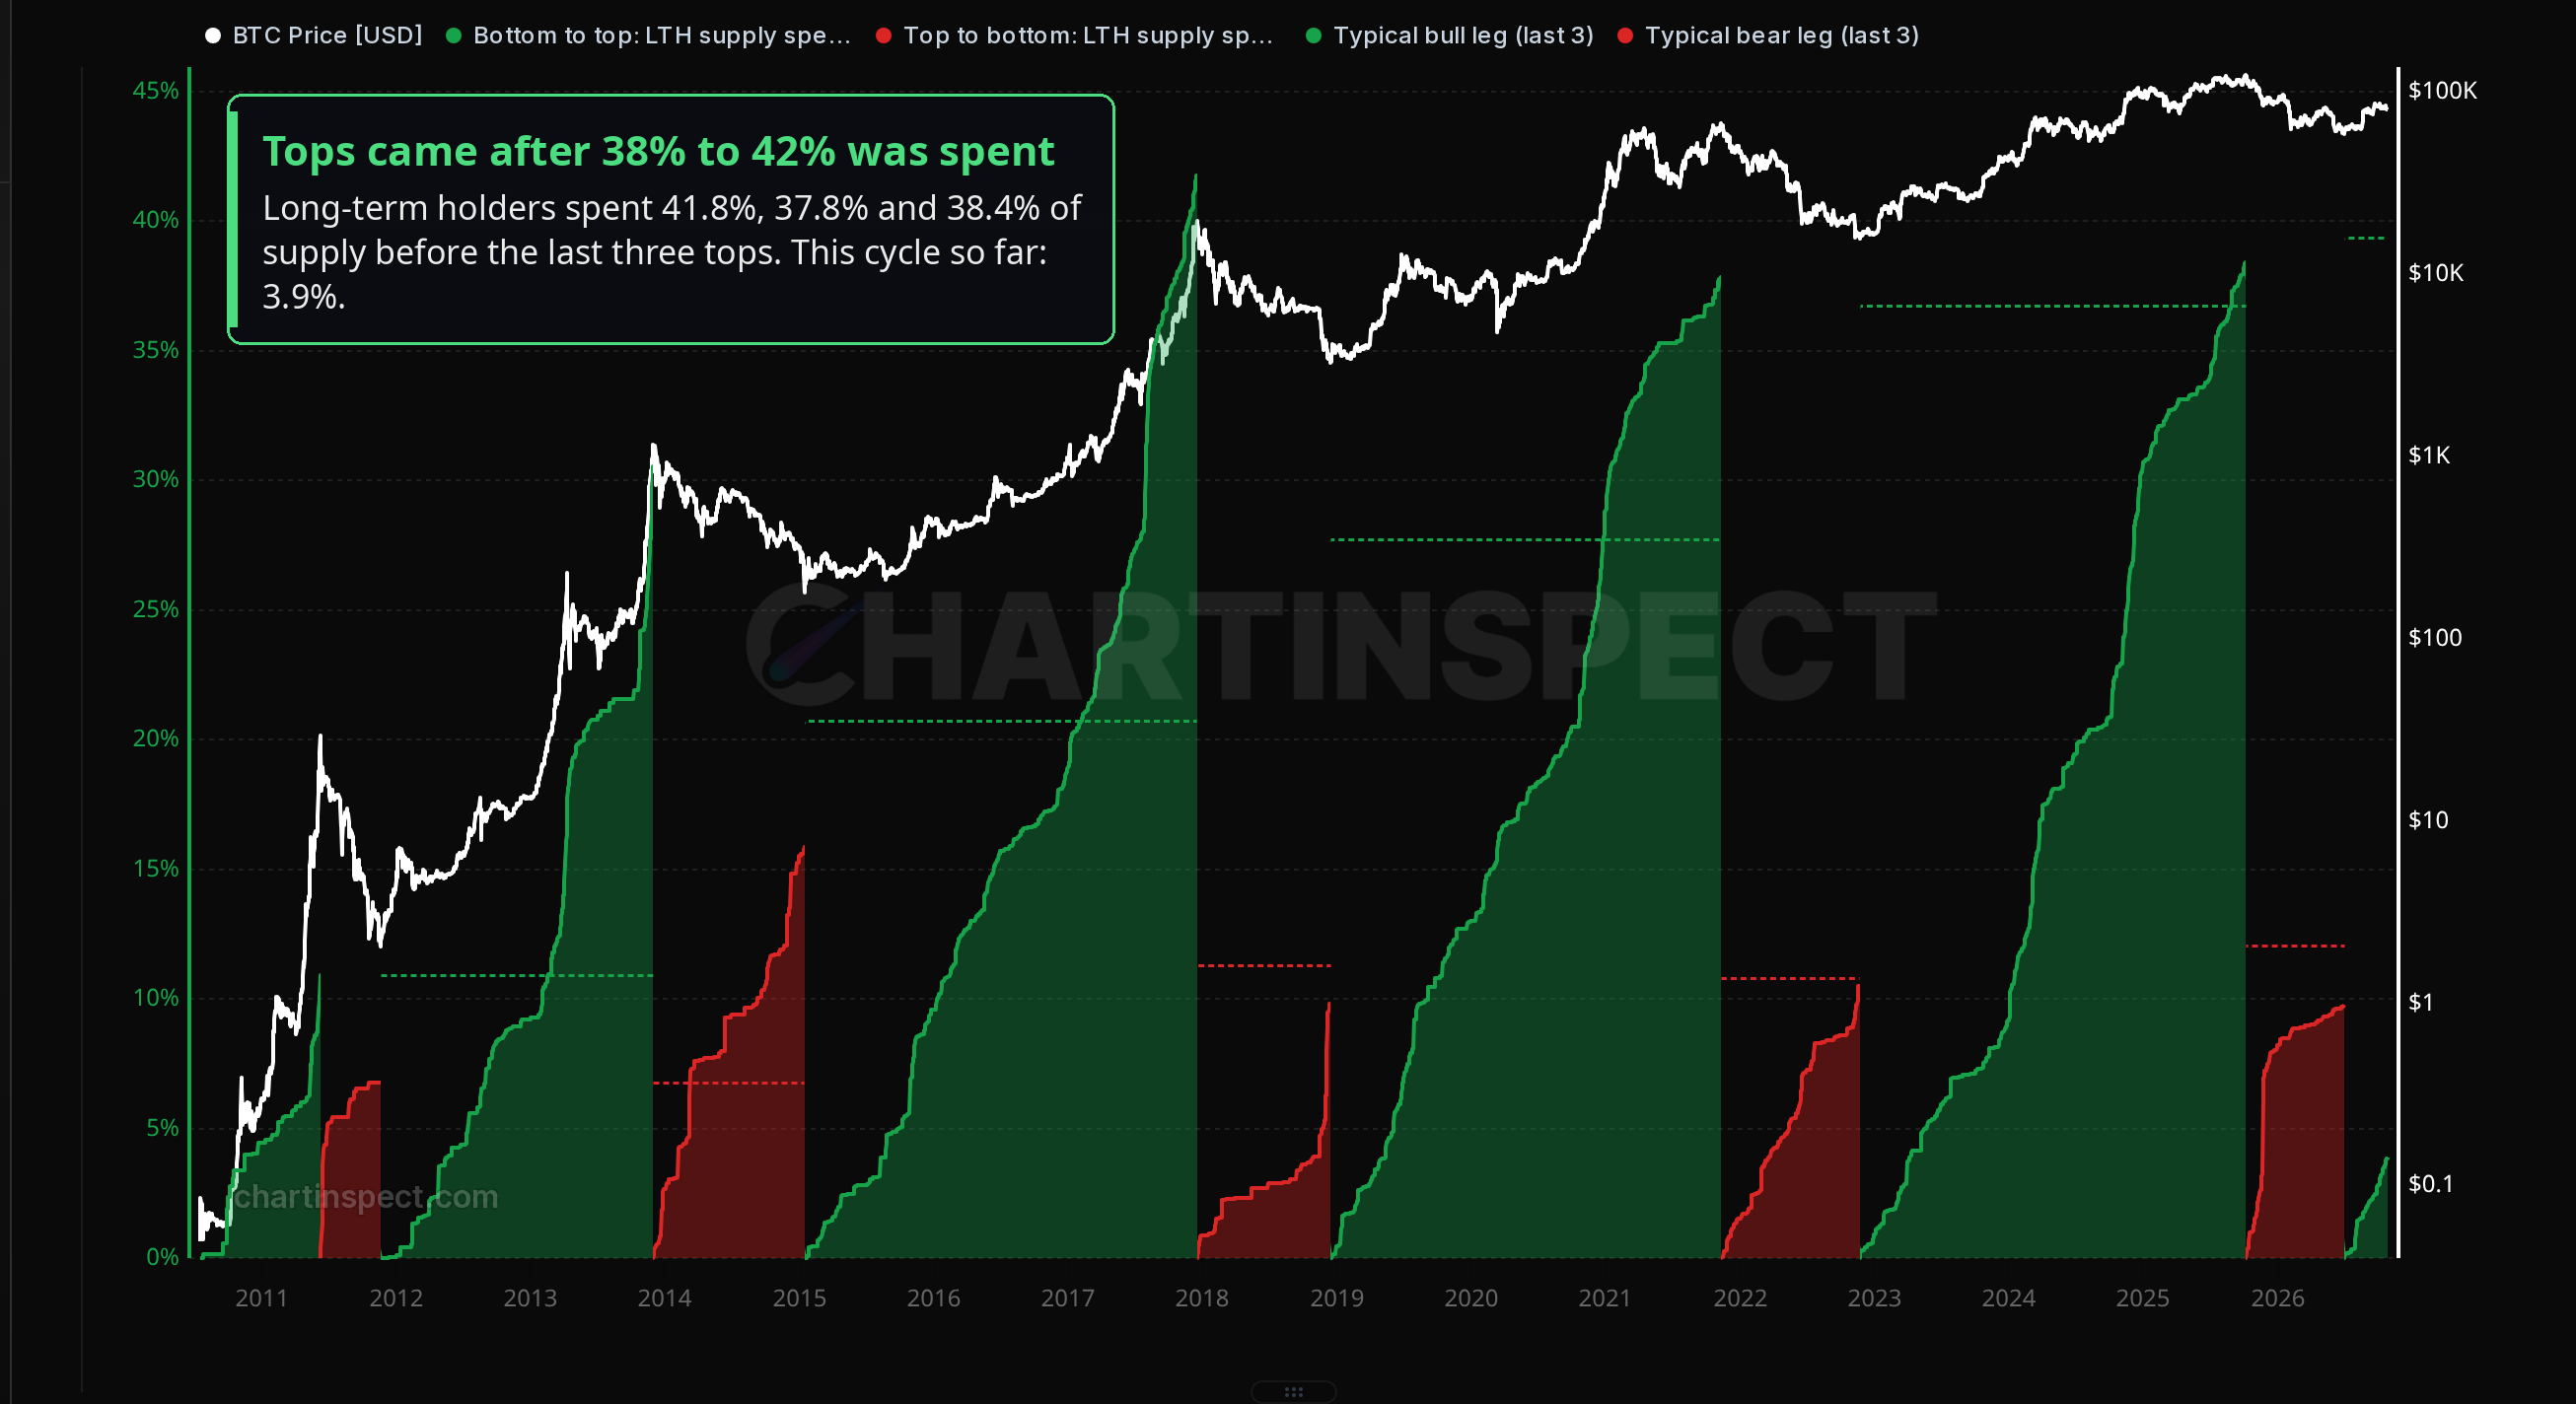
All six models are built on price and cost basis. This chart looks at the other side of a top, which is who's selling. Long-term holders are coins that haven't moved in more than about five months, and bull markets tend to end once enough of them have sold to new buyers.
Open LTH Distribution by Cycle Phase
| Bull run | At the first new high | At the top |
|---|---|---|
| 2015 to 2017 | 21.3% | 41.8% |
| 2018 to 2021 | 24.7% | 37.8% |
| 2022 to 2025 | 13.7% | 38.4% |
Each of the last three tops came after long-term holders had sold 38% to 42% of the supply, and unlike the price multiples, that number hasn't been getting smaller. It also shows the first new all-time high has never been the top, since by then they'd only sold between a third and two thirds of what they eventually would. This cycle they've sold 3.9% in the 118 days since the June low, a little faster than the 2.5% to 3.2% of past cycles at the same point.
I'll use this to sanity-check the dates. If long-term holders have sold less than about 30% by May 2029, the timing models are probably early.
Ethereum
Open the screener for Ethereum
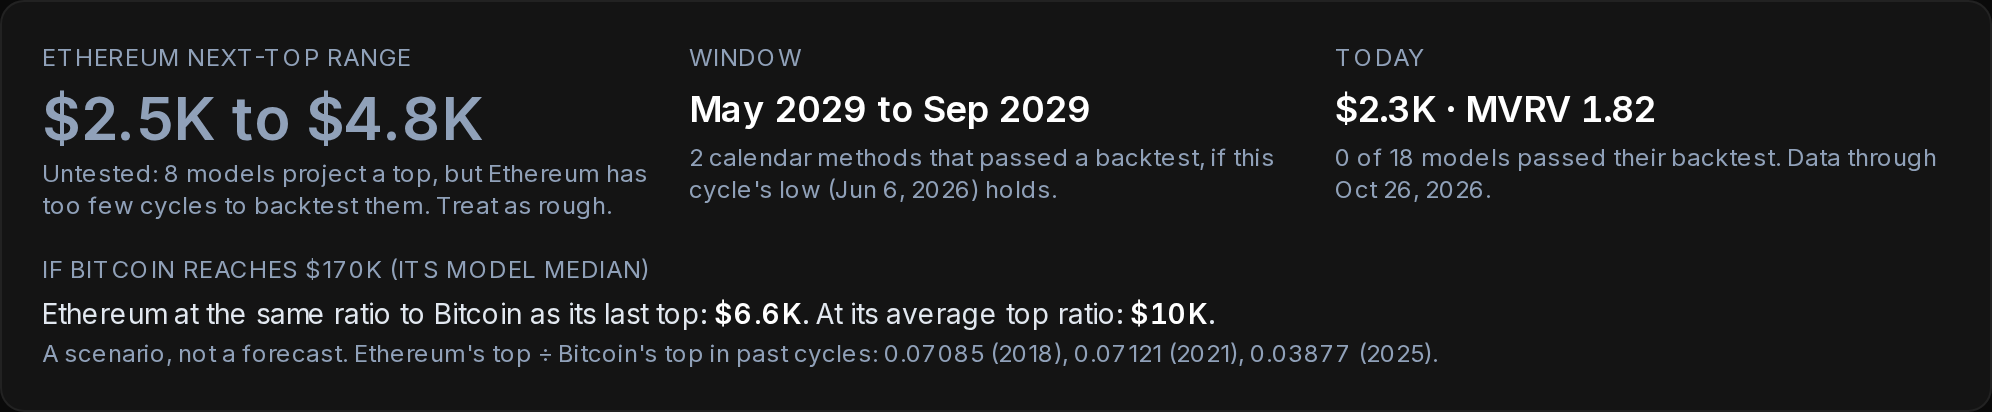
Ethereum only has three cycle tops so far, which isn't enough to backtest any of the models. So instead I look at it against Bitcoin.
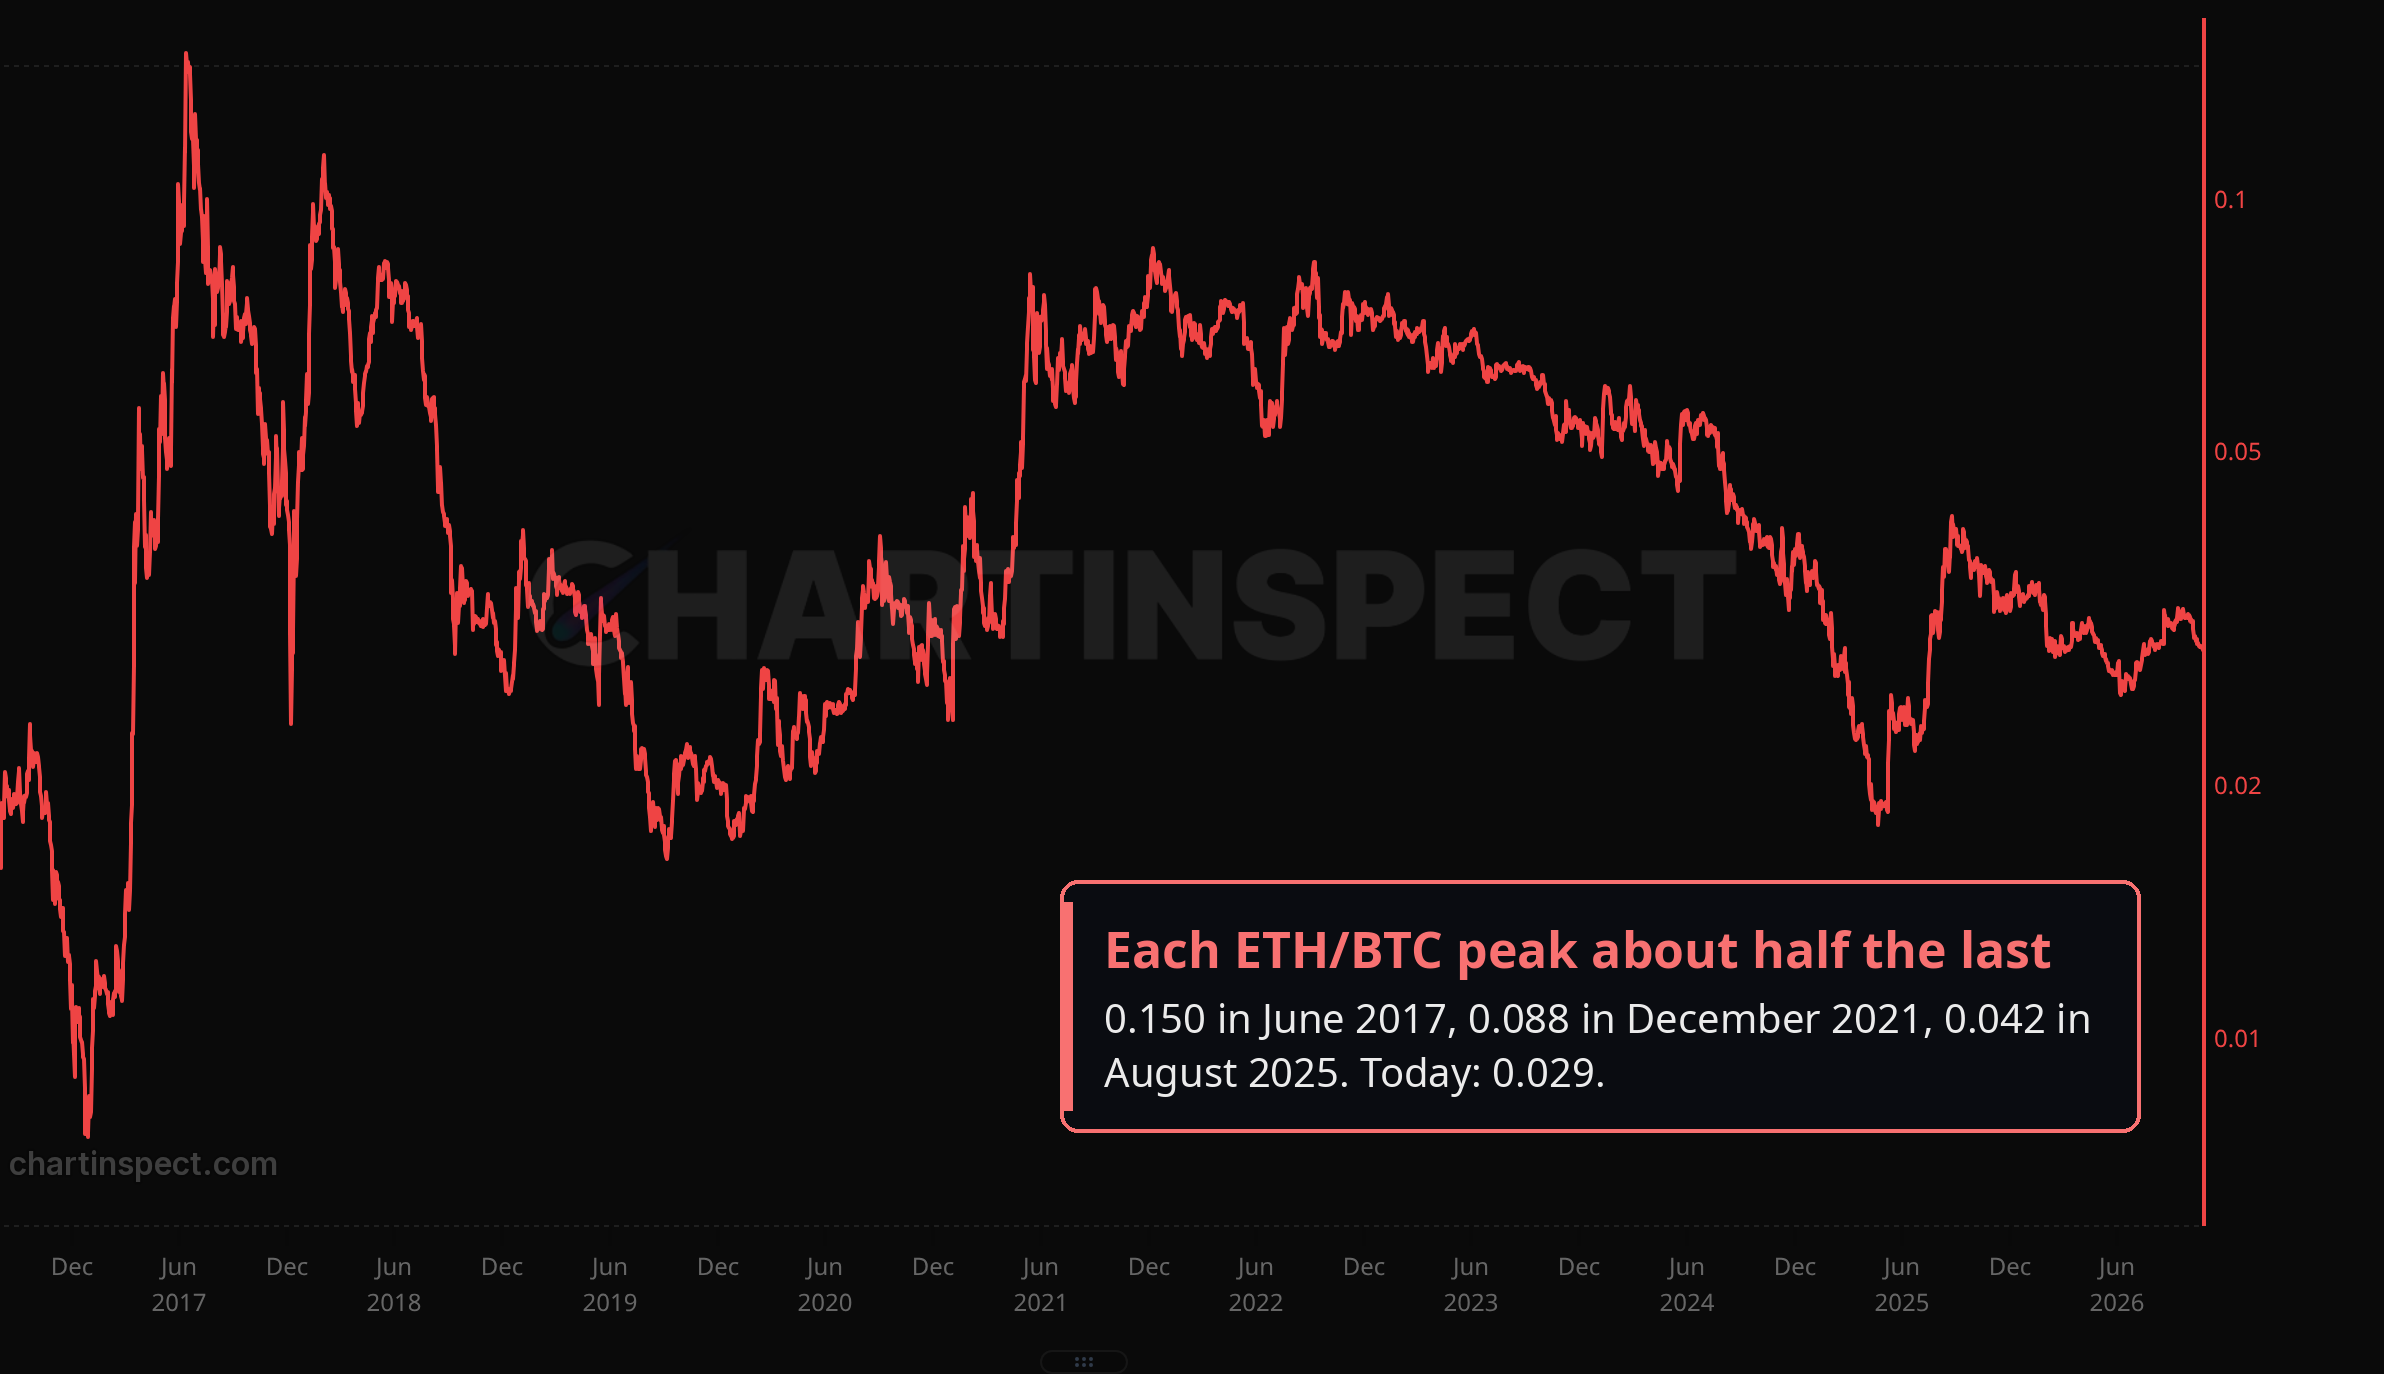
If Bitcoin gets to $170K and ETH tops at the same ratio to Bitcoin as last cycle, that's $6.6K. At its average ratio across all three cycles, it's $10.2K. But the ETH/BTC chart shows a less comfortable possibility too. Each cycle's peak in the ratio has been about half of the one before (0.150, 0.088, 0.042), and if that continues, ETH would top around $3.8K. So I think of it as $3.8K in the bear case, $6.6K in the middle and $10.2K in the bull case. ETH is at $2,324 today, and its cycle low was $1,563 on June 6. Personally, I'm still very bullish on Ethereum long term, and I'm DCAing into it at these prices.
Where I stand
Looking at all these models, one of two things has to happen. Either the shrinking keeps going and Bitcoin slowly turns into a more mature asset, or something breaks the pattern.
A shrinking path isn't bad for holders, though. You might look at these numbers and think Bitcoin will never do another 2x, and I don't think that's true. It hasn't been true for the S&P 500 or the Nasdaq either. Even the $170K median works out to about 9% a year from the last top, with inflation at around 3%. That's smaller than the returns we've had before, but it's still way ahead of the dollar.
The pattern can also break in either direction. On the positive side, if buyers like the ETFs or governments come in bigger than anything we saw in past cycles, that could push the top well past these models. On the negative side, if the next top can't clear something like $130K to $140K, that would be the first lower top Bitcoin has ever had.
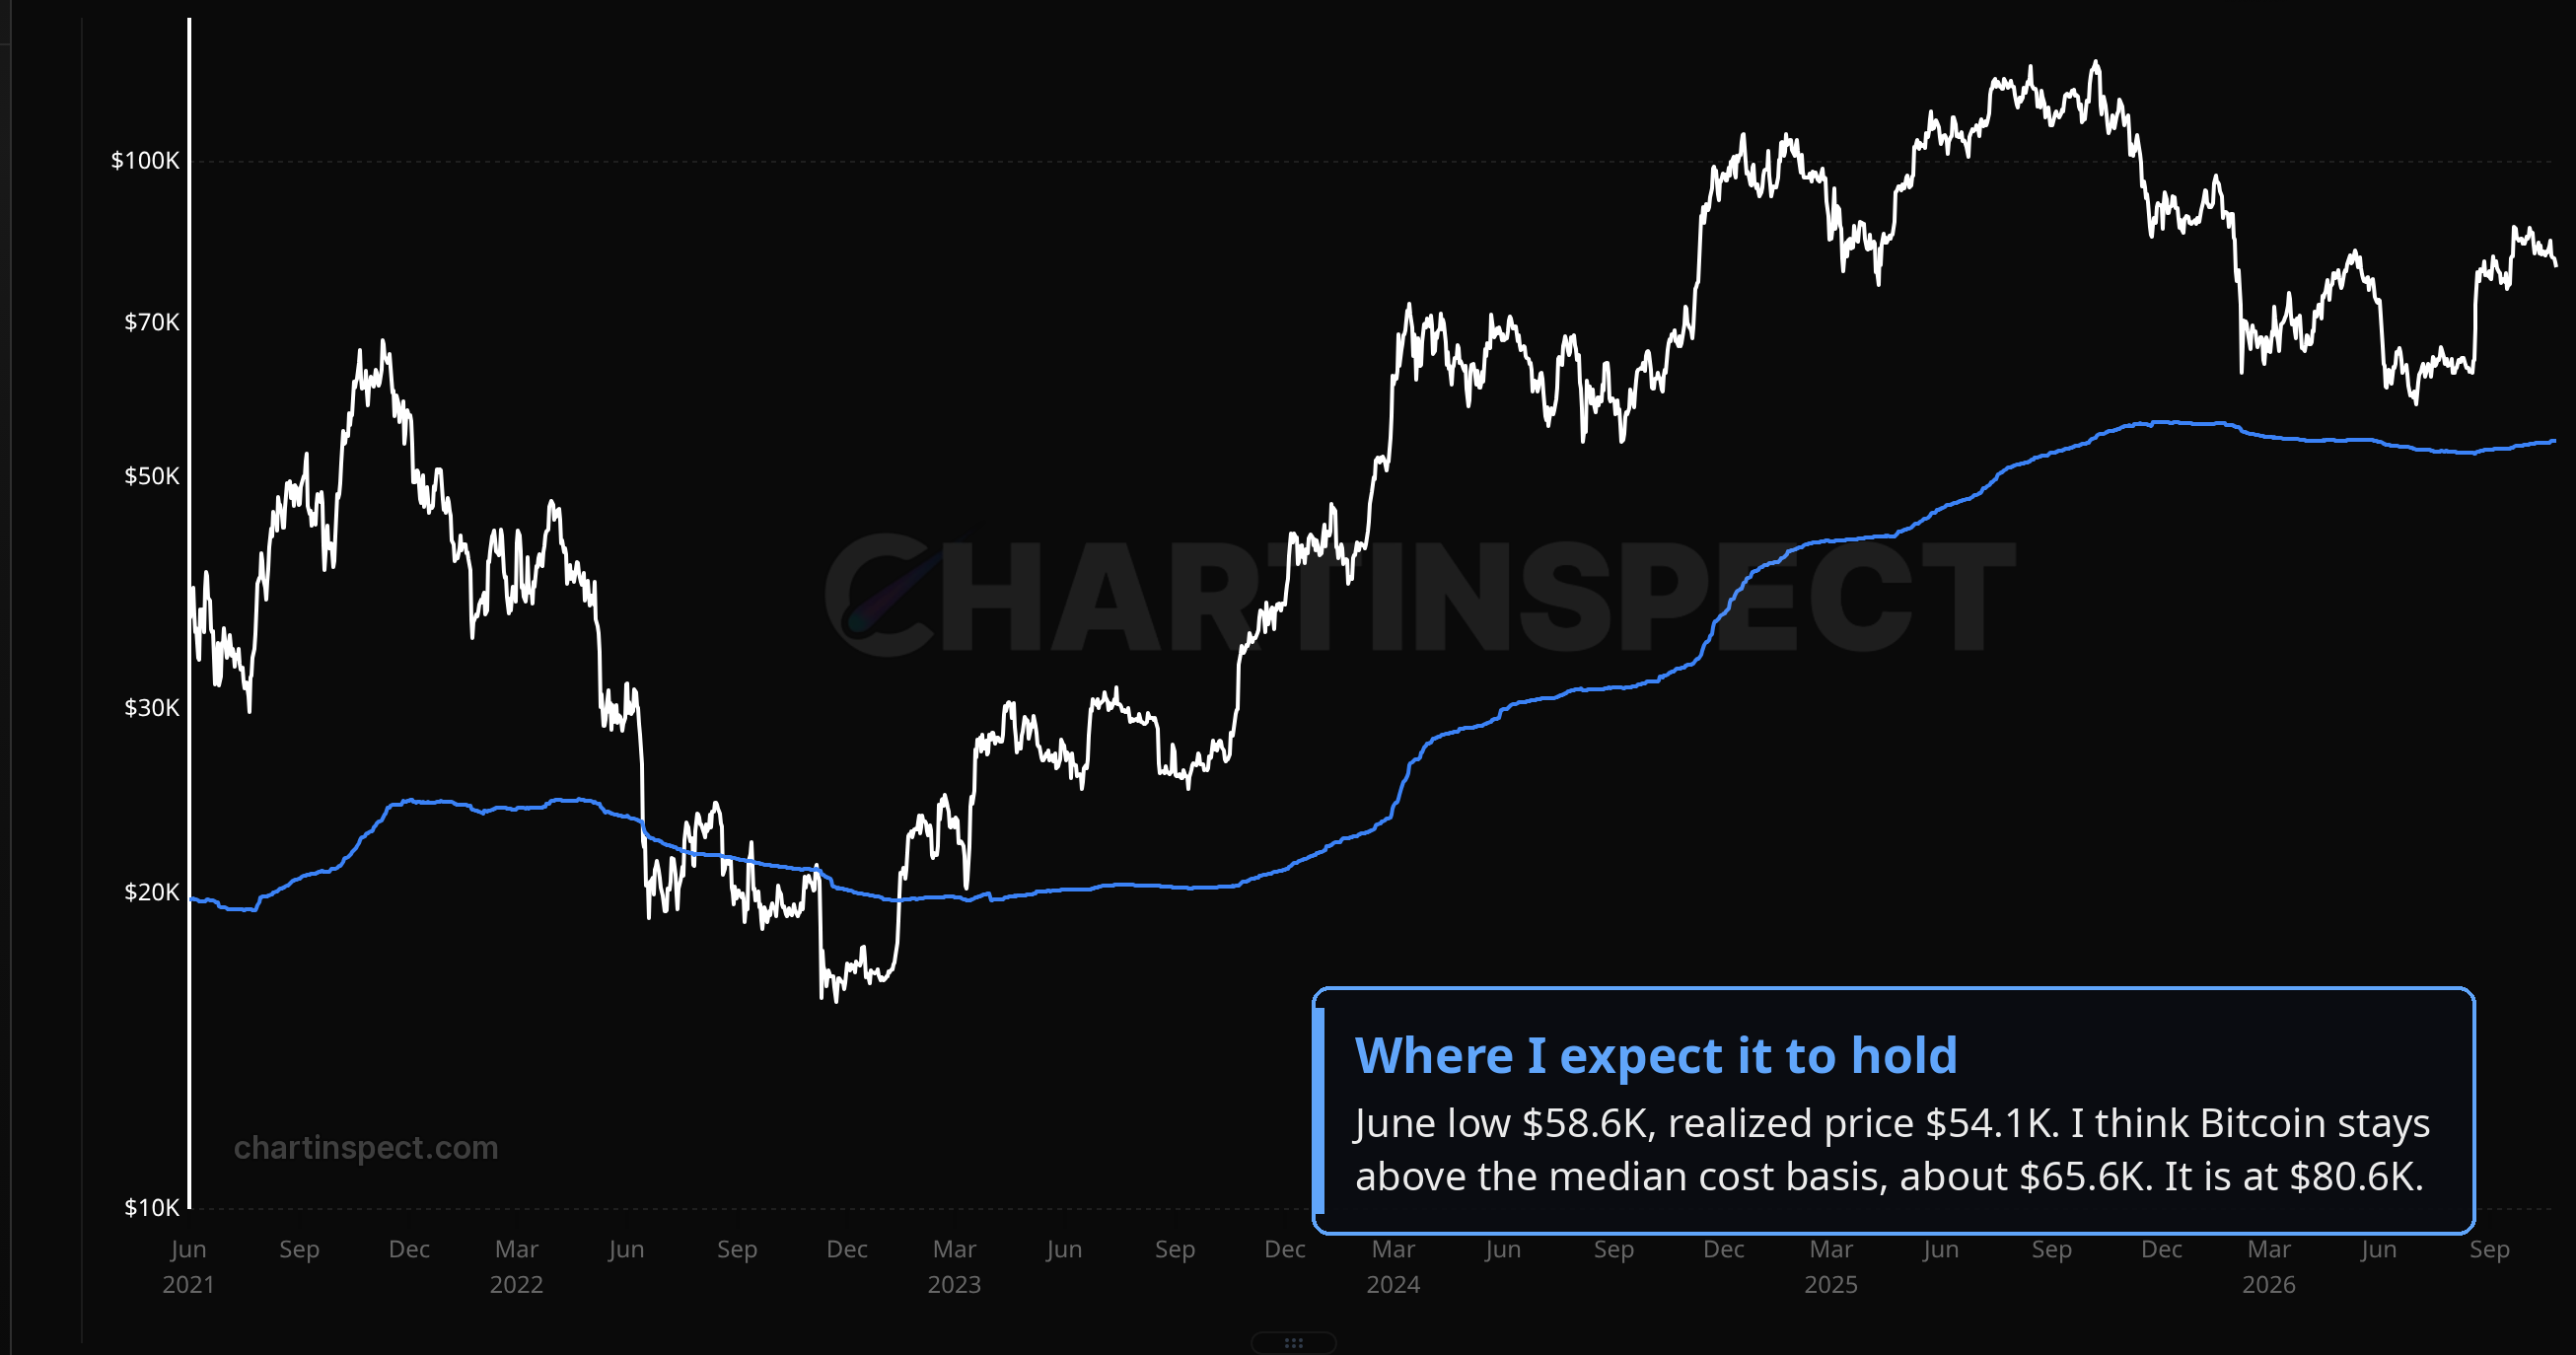
The levels that would tell us the bottom isn't in are the June low around $58,000 and the realized price around $54,000. Below $58K, the bottom wasn't the bottom and these models are off. Below $54K, Bitcoin would break the level this whole market has held. I don't think either of those happens. I think Bitcoin stays above the median cost basis, which is the typical holder's cost basis and sits at about $65,600 right now.
So my base case is that Bitcoin keeps maturing and the returns get a bit smaller, but a limited-supply asset that anyone in the world can own still beats the dollar. History is a guide, not a guarantee, and if the data changes, I'll change my view and tell you.
The Cycle Top Screener is completely free and updates every day, so you can check all of this yourself.
Not financial advice. Do your own research.
Enjoyed this article?
Subscribe to get the latest research in your inbox.
Comments
Sign in to join the discussion.