Bitcoin's Recovery Meets Its Next Test
I still think June was the low. Nine charts show the support levels I'm watching, the 2023 retest comparison, and what would change my view.

I still think June was the low. The part I'm less sure about is how easily Bitcoin gets through the supply above it.
In this week's video, I said I wouldn't be surprised by a pullback or a stretch of sideways trading after the rally. I still think that's a reasonable expectation. Some holders will take profits. Others may use a recovery to get out near break-even.
I'm watching where buyers show up during that process. True Market Mean is the deeper level I want to see hold. If Bitcoin loses it and struggles to recover it, short-term holder cost basis becomes the next important test.
Where I'd expect buyers to step in
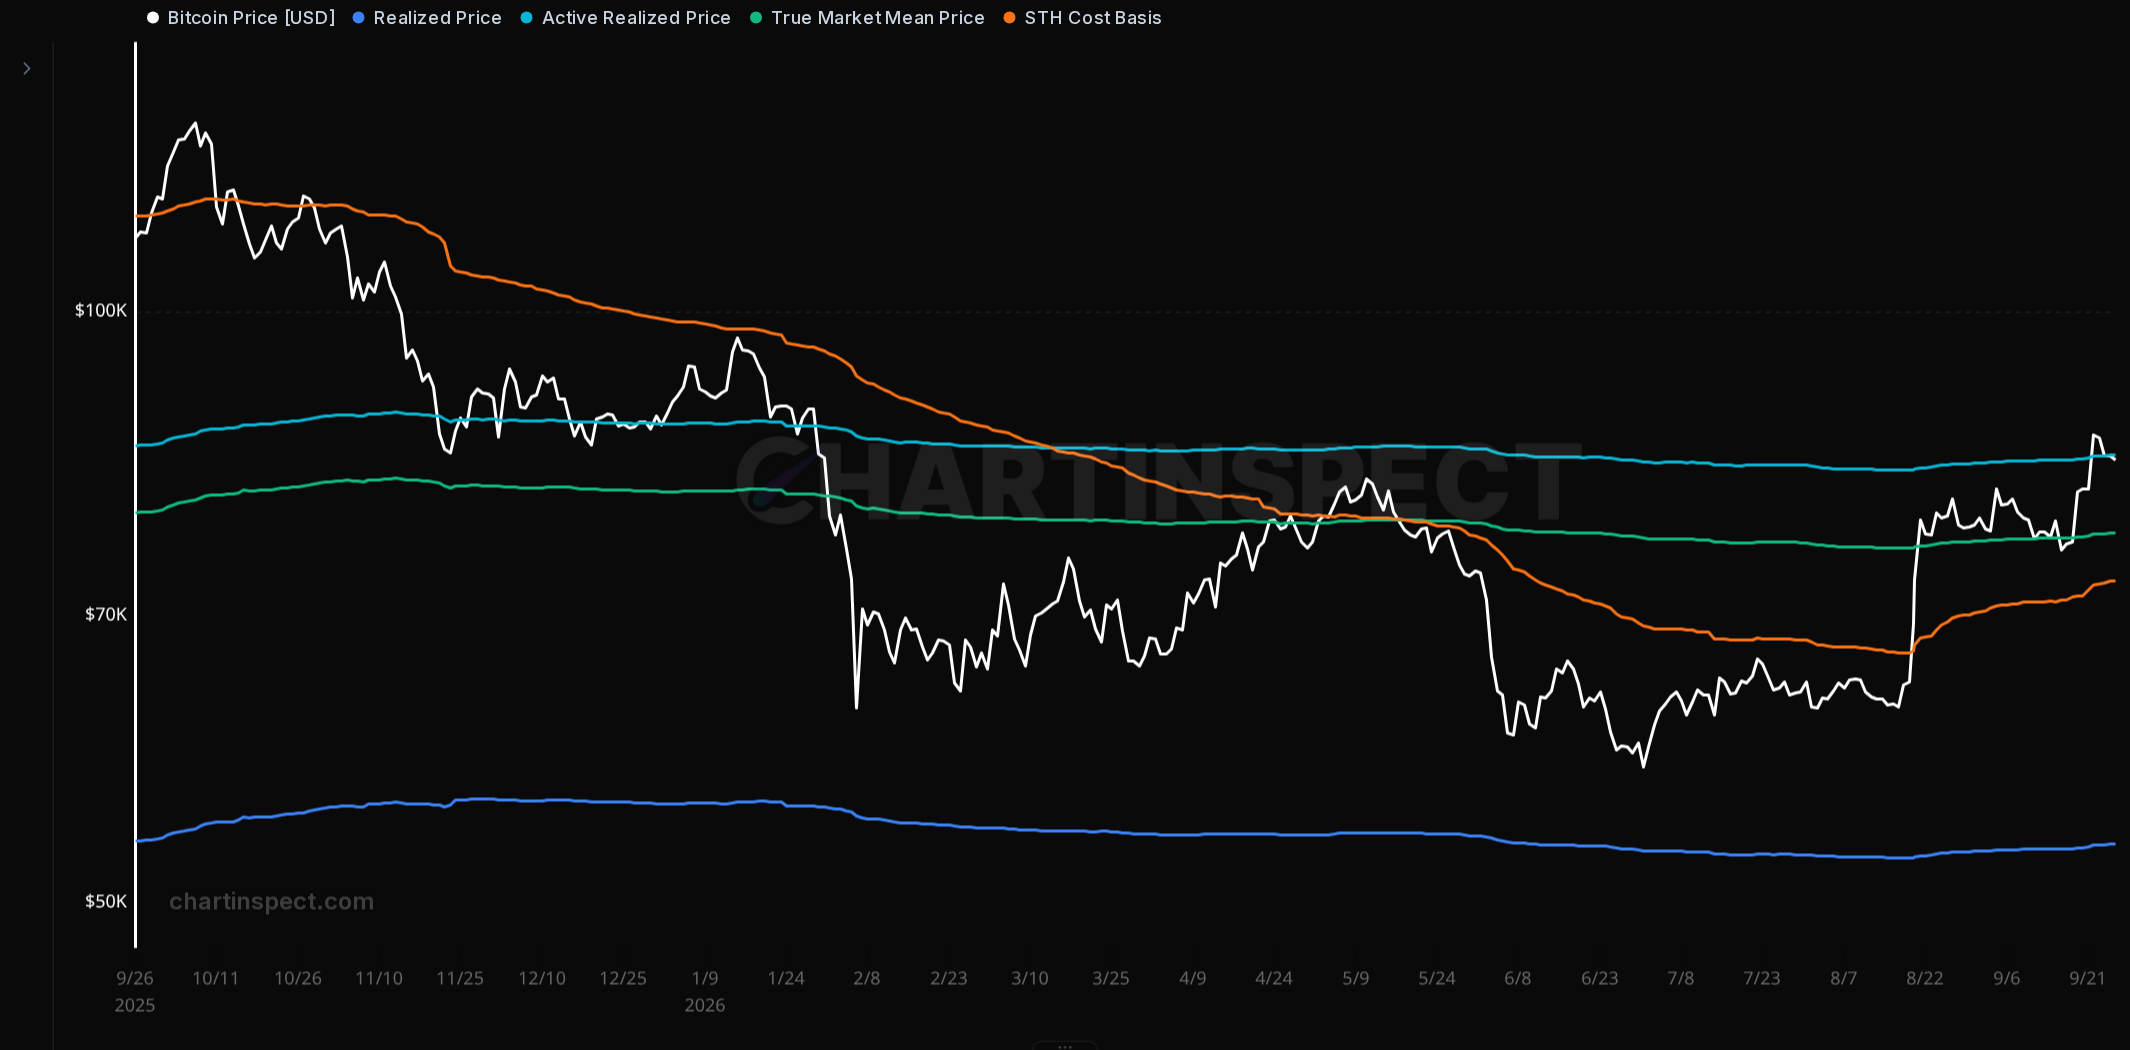
In March's newsletter, True Market Mean and short-term holder cost basis were levels Bitcoin still needed to recover. The question I raised in the recent video was whether buyers would defend them on a return.
Bitcoin is sitting slightly below active realized price, so the first thing I want to see is a recovery above it. Below the market are True Market Mean and then short-term holder cost basis, where recent buyers move back toward break-even.
A quick dip below a level wouldn't settle the argument for me. I'd care more about whether Bitcoin gets back above it and holds. Repeated failed attempts to recover it would make me take the weakness more seriously.
Why June still matters
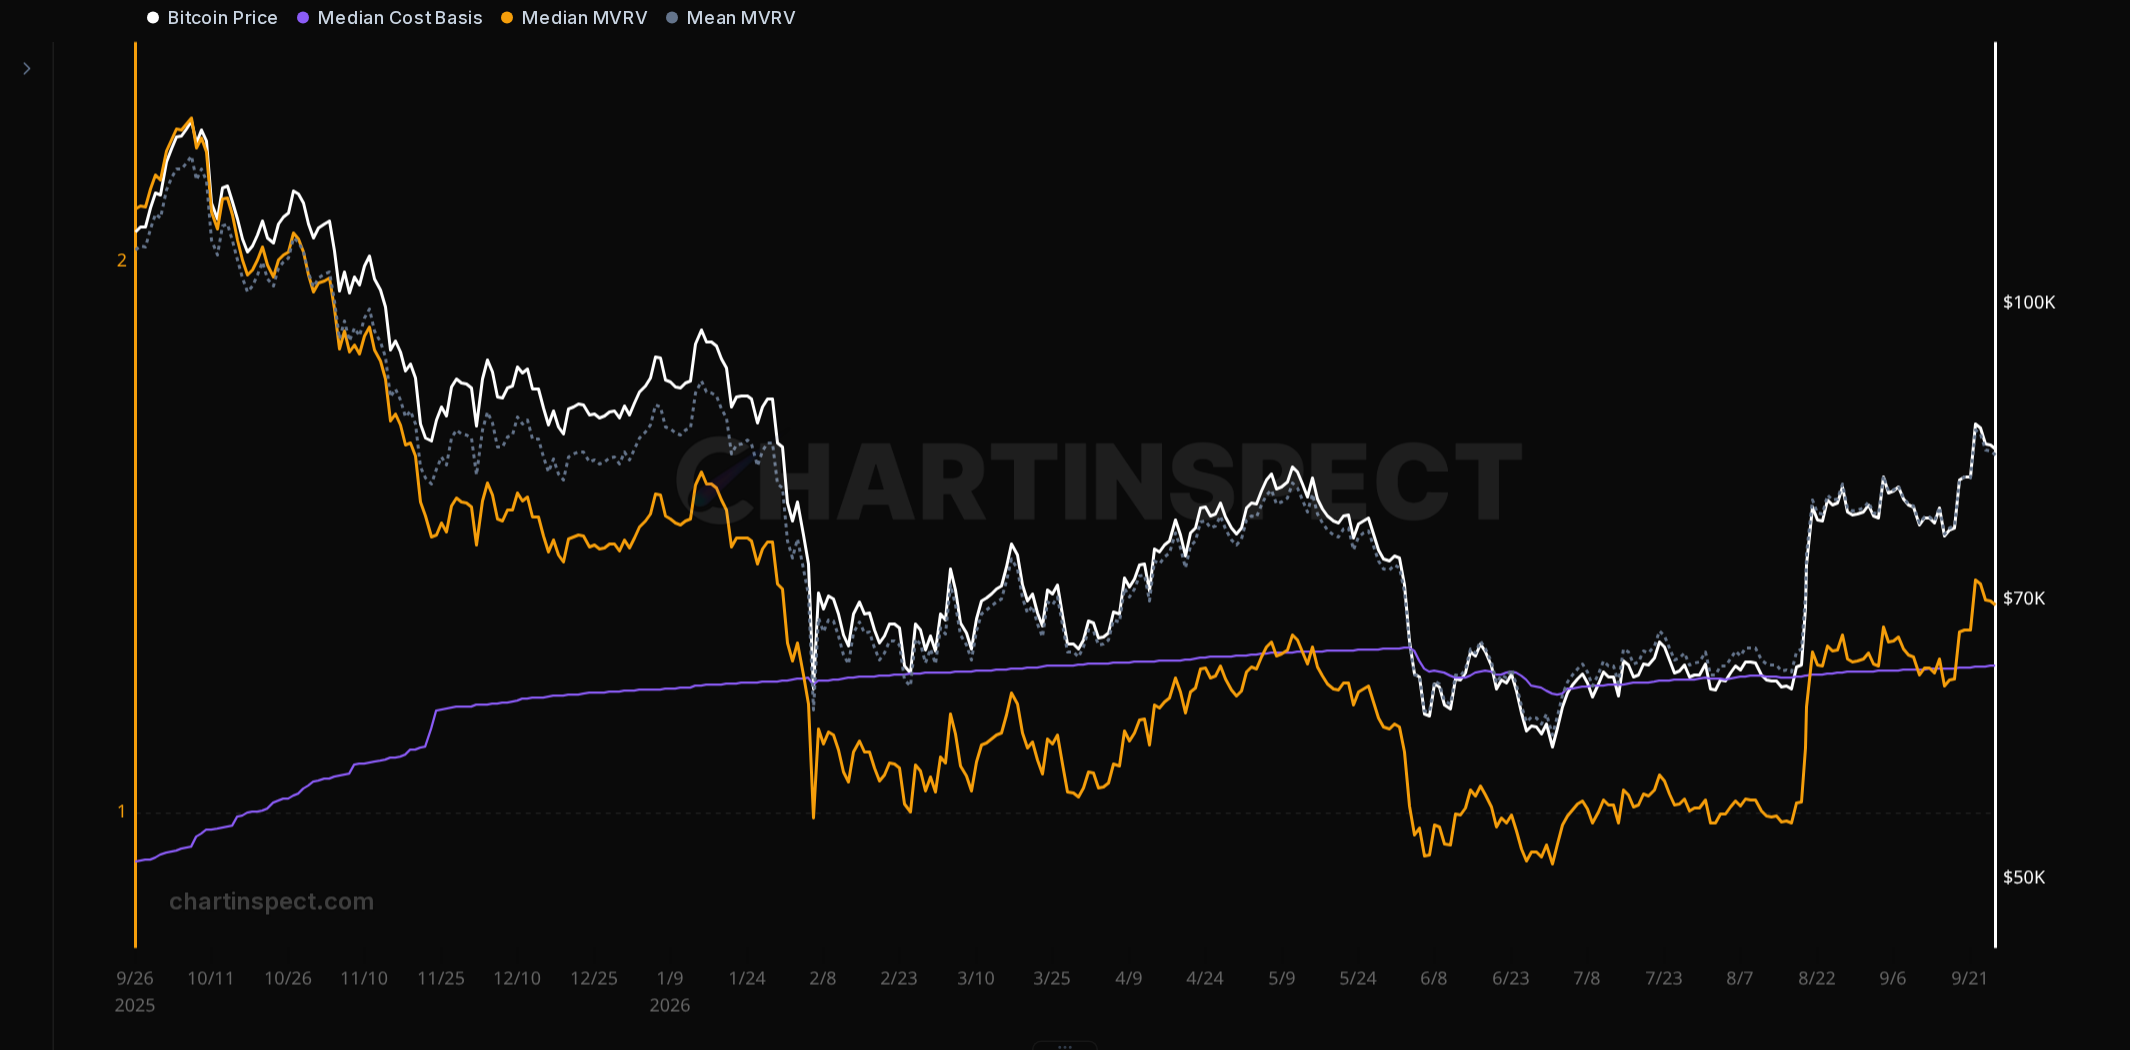
One reason people kept waiting for lower prices was that Bitcoin never fell below realized price. That had been an important feature of previous bear-market lows.
But June looked different when you measured the median cost basis. Median MVRV fell below 1, even though mean MVRV stayed above it. Holders were under pressure even without the usual mean-MVRV signal.
That distinction mattered to my view. I didn't want to dismiss what was happening because it didn't fit an old cycle target. In my discussion with Matt and Tom, we returned to the same problem: how much weight should we give the usual bear-market timetable when the market is behaving differently?
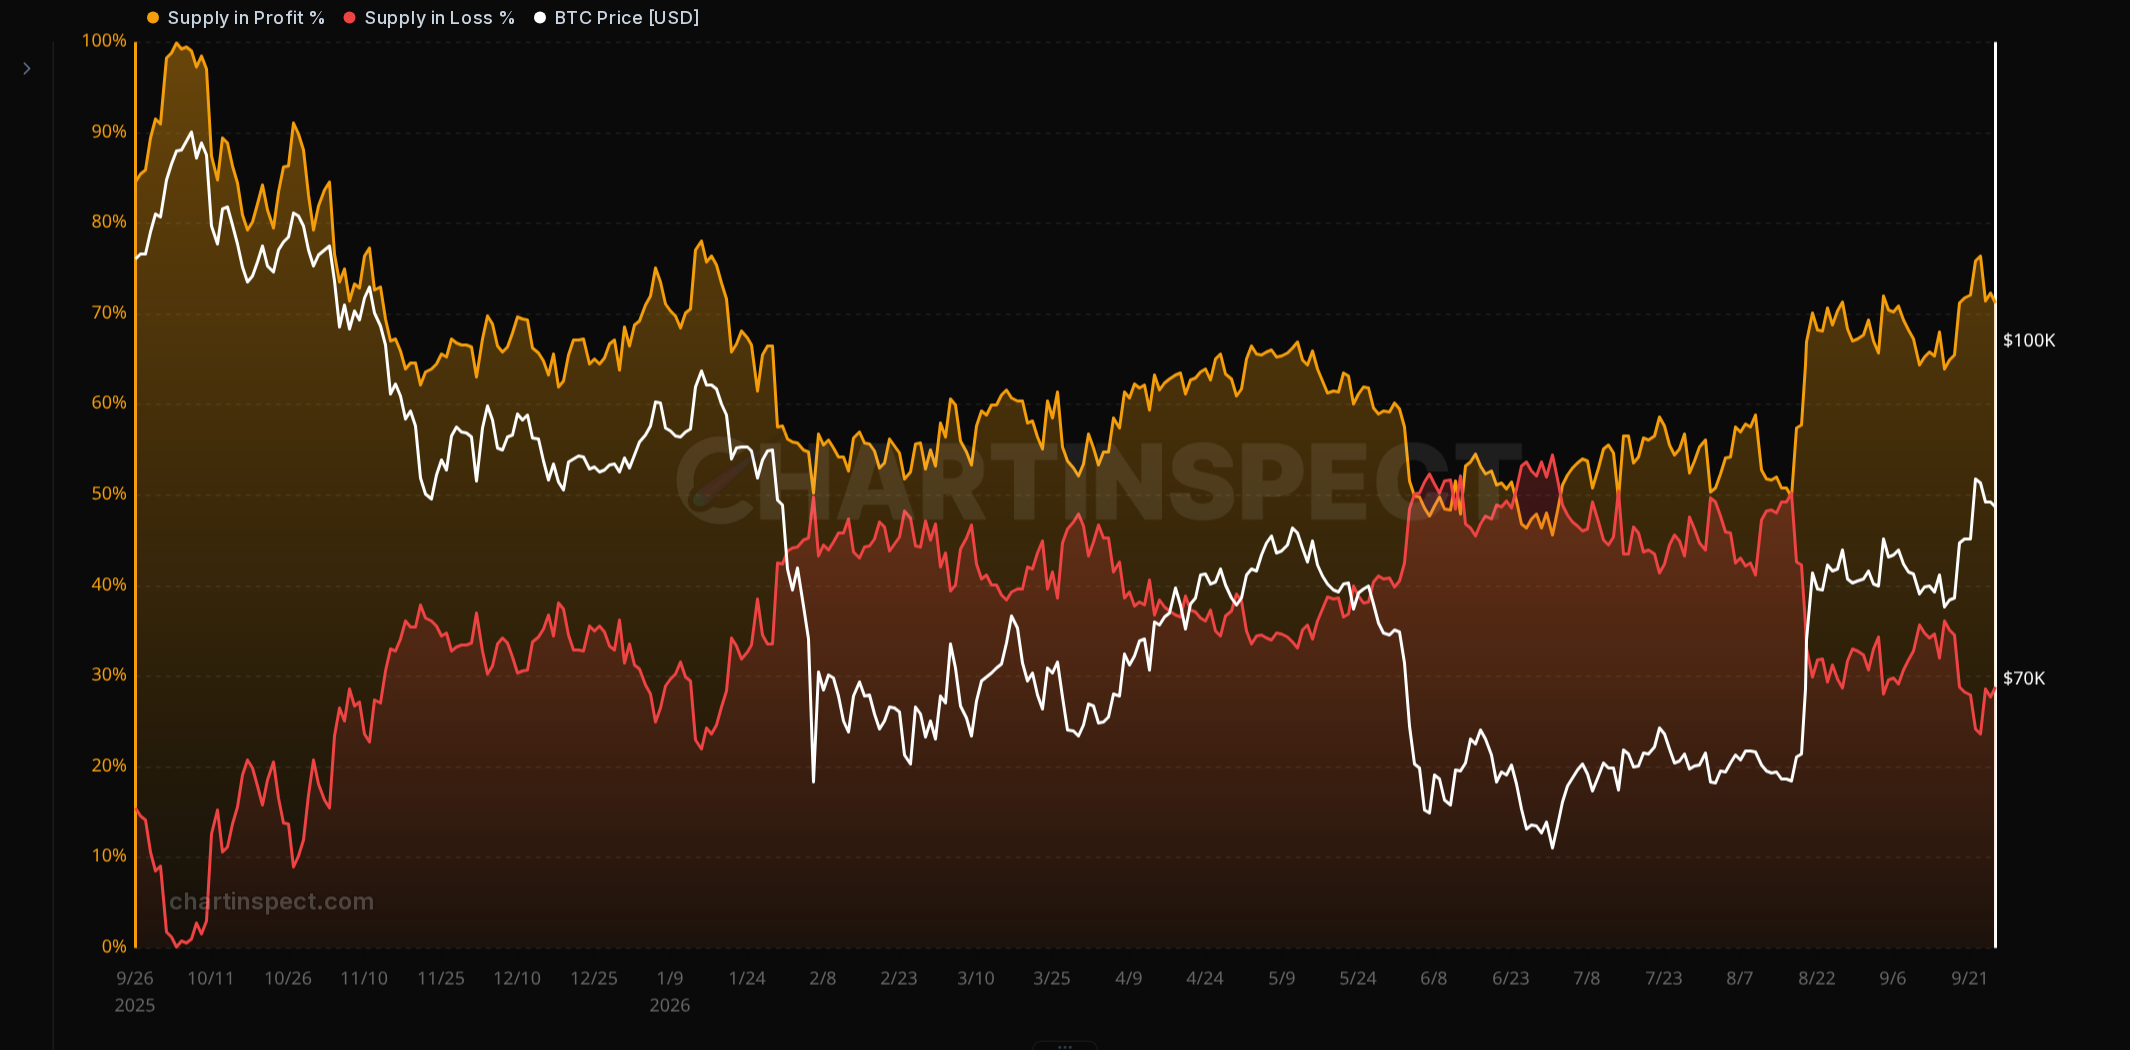
Open Supply in Profit and Loss
At the June low, only about 45% of supply was in profit. Together with the median cost-basis reading, that helps explain why I became more interested in the recovery.
A rise in supply in profit doesn't necessarily mean new buyers have arrived. Price alone can move existing coins from loss into profit. It tells us that holders are under less pressure; it doesn't tell us how strong the next wave of demand will be.
What I meant by the 2023 comparison
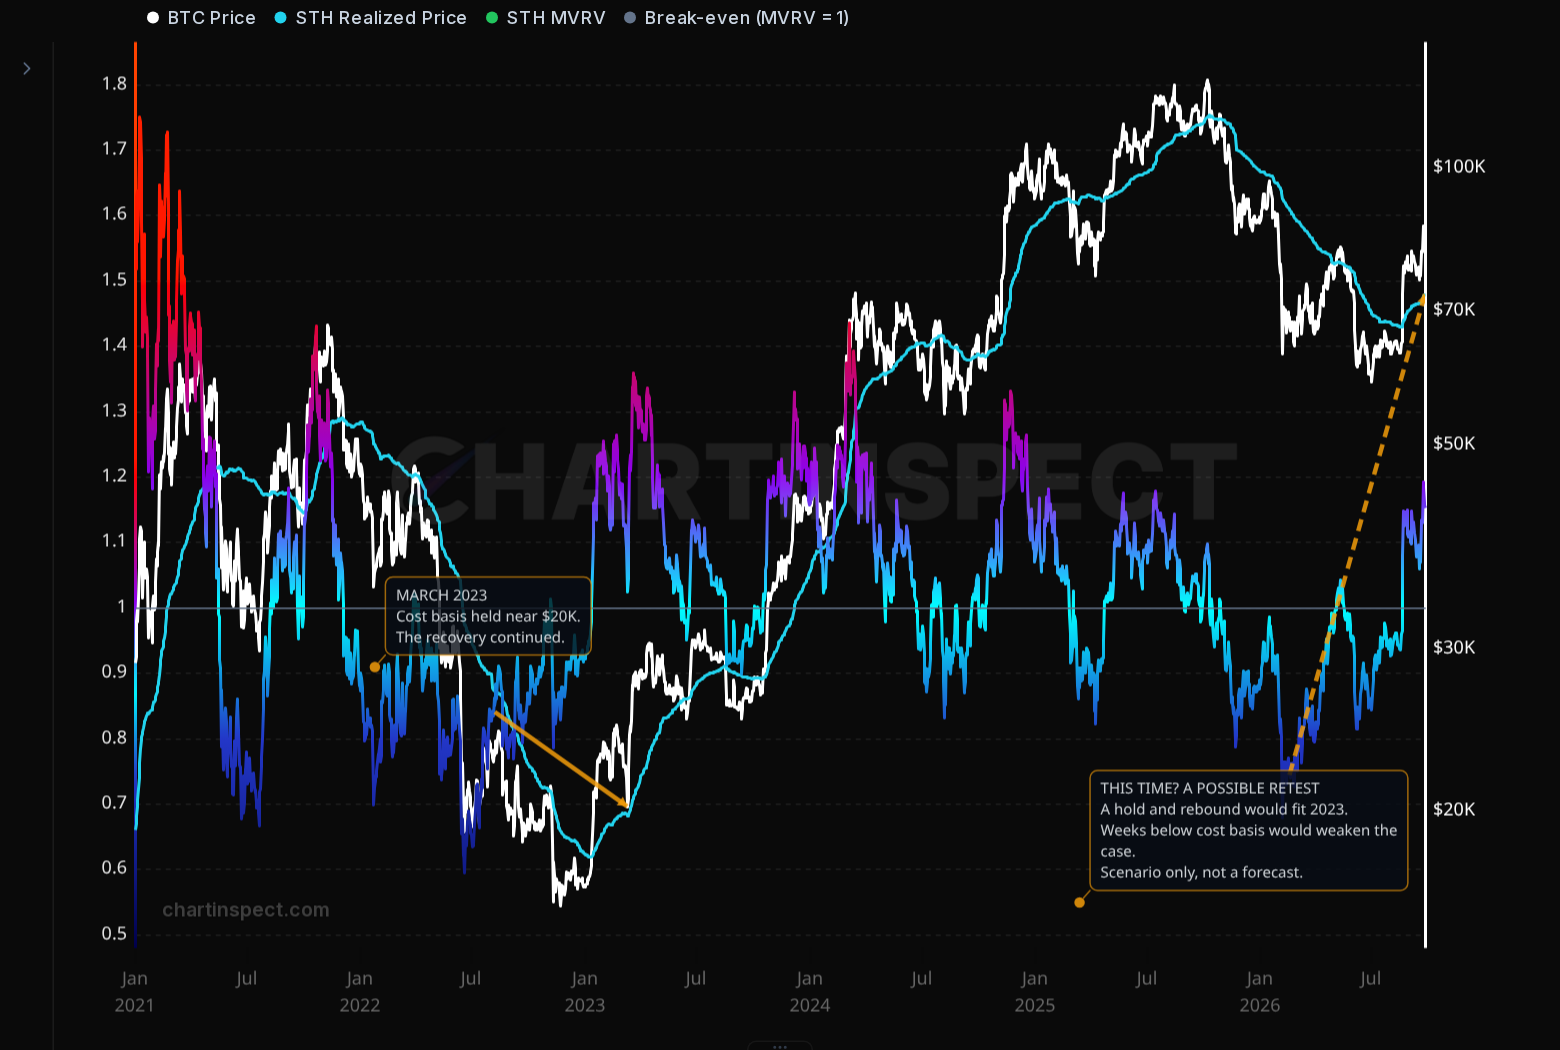
View the annotated chart full size · Open Short-Term Holder MVRV
The part of 2023 I have in mind is the March pullback. Bitcoin had recovered above short-term holder cost basis in January, then came back toward it near $20K. On March 10, STH MVRV was about 1.02, putting recent holders close to break-even. Buyers stepped in, and Bitcoin traded above $30K in April.
That's the sequence marked by the solid arrow: recover the level, come back to test it, and find buyers. Cost basis did give way later in 2023, so I wouldn't treat that one successful retest as a permanent floor.
A return toward short-term holder cost basis is possible this time too. If buyers defend it and STH MVRV turns higher from around 1, that would strengthen my view that the recovery has more room to run. Bitcoin could also keep moving higher without making the full trip back.
The response matters more to me than whether we touch an exact price. A brief dip followed by a recovery would leave room for the bullish case. Spending weeks below cost basis, especially while recent buyers keep realizing losses, would make the comparison much less convincing.
Holding a loss and taking a loss are different
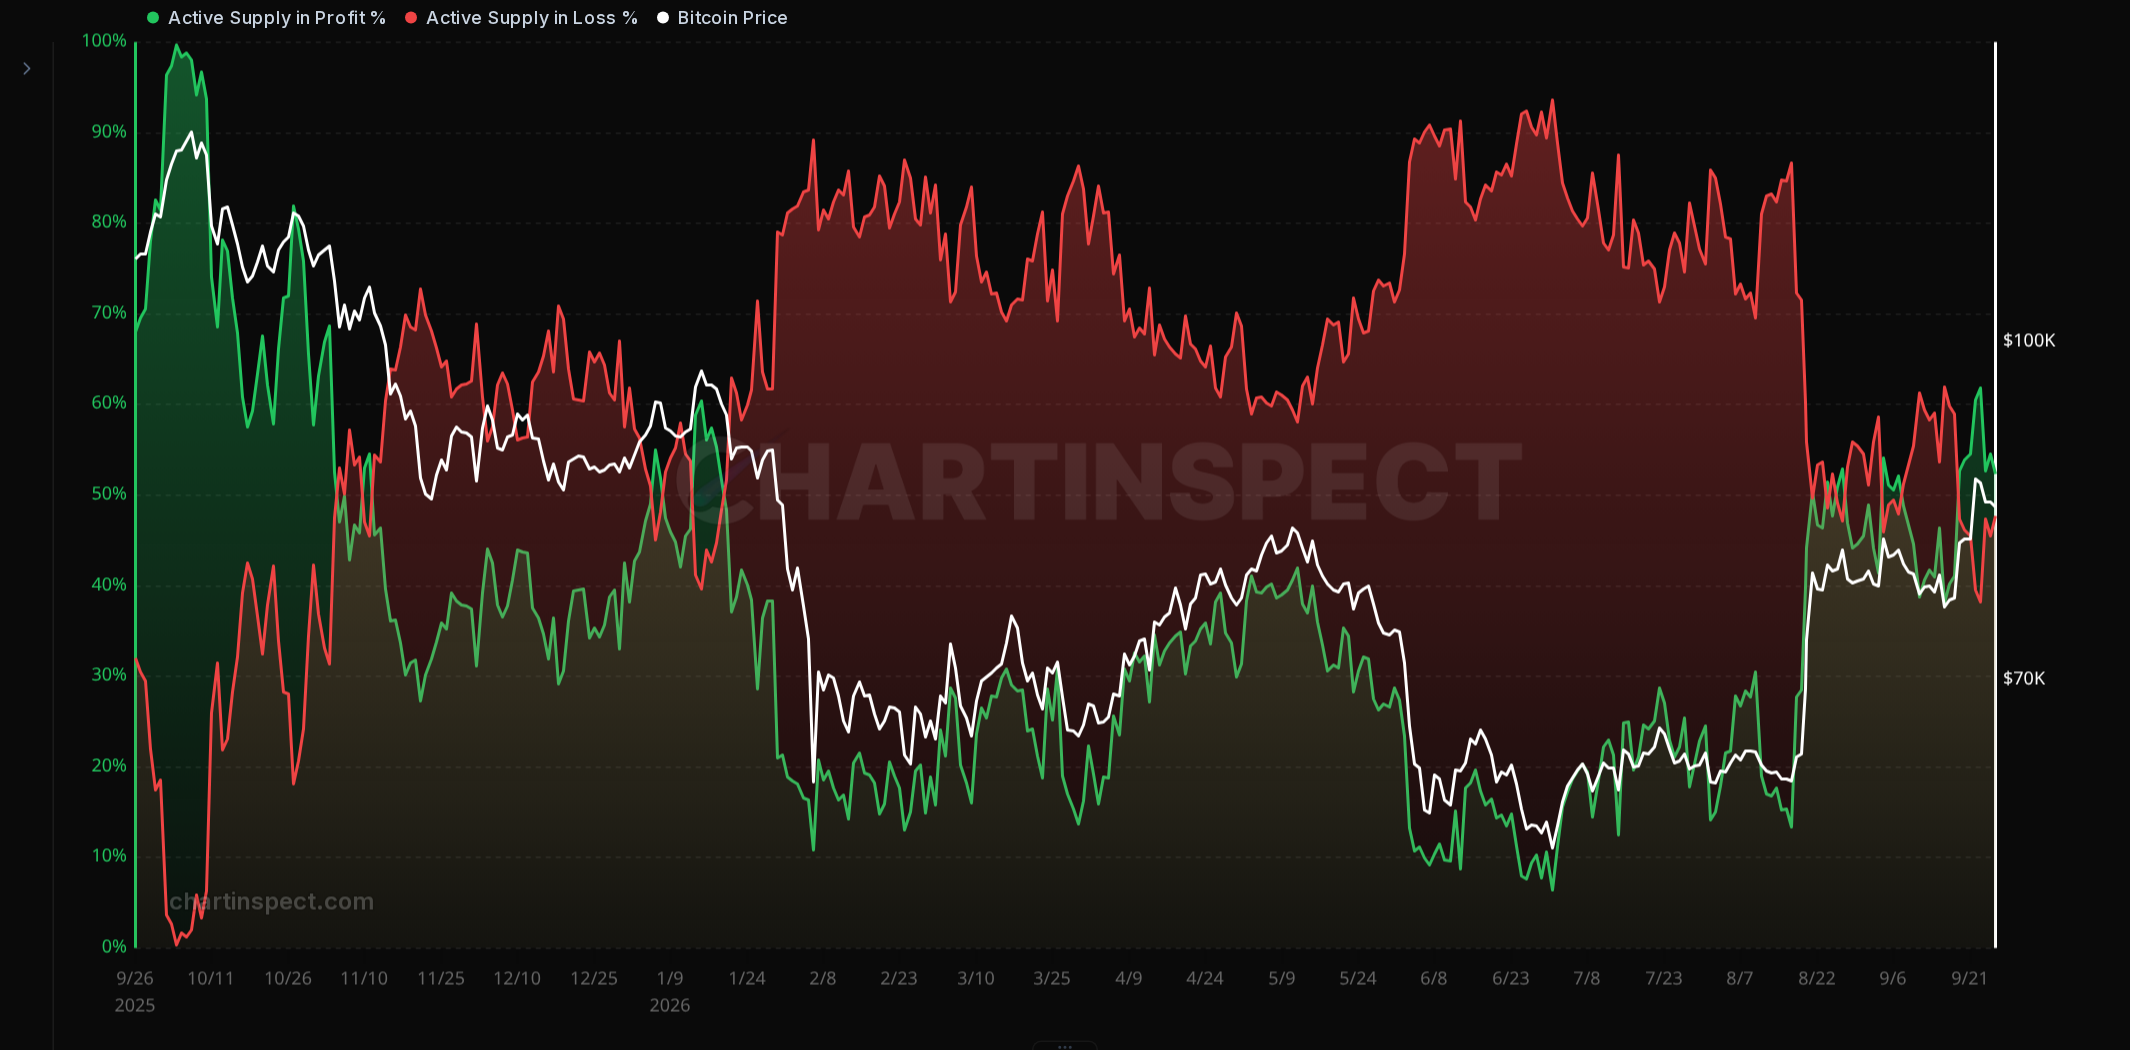
Open Active Supply in Profit and Loss
I highlighted the active-supply crossover in the video because I want to see more of that supply stay in profit through a pullback.
More active supply in loss than in profit for a couple of weeks would concern me. One weak daily reading wouldn't be enough.
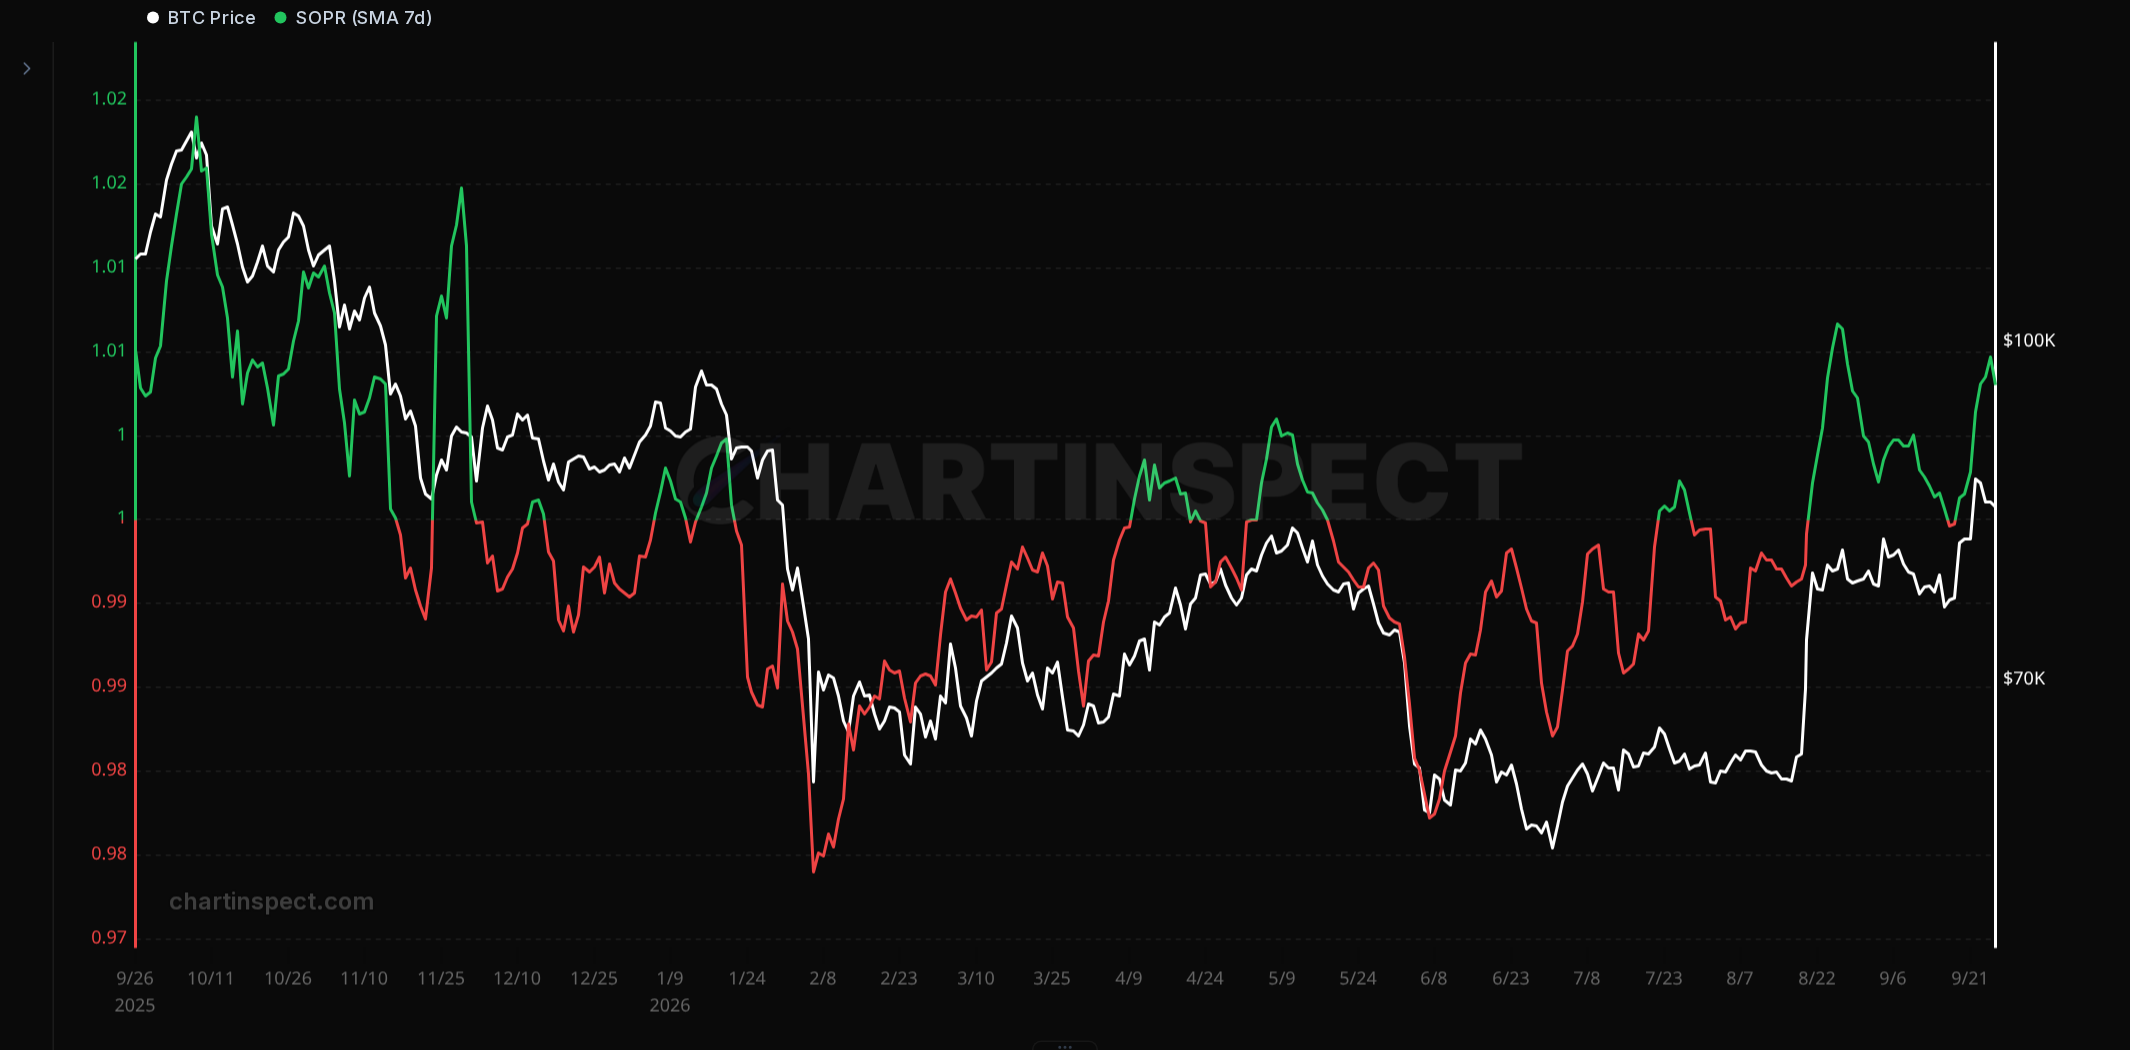
SOPR adds the spending side. Above 1, coins being spent are, in aggregate, realizing gains relative to their previous on-chain value. Below 1, they're realizing losses. I use the seven-day average here to reduce the noise of individual days.
Profit-taking after a rally is expected. Persistent loss-taking would concern me more, particularly if it came with a loss of support and worsening holder profitability.
The supply above price still matters
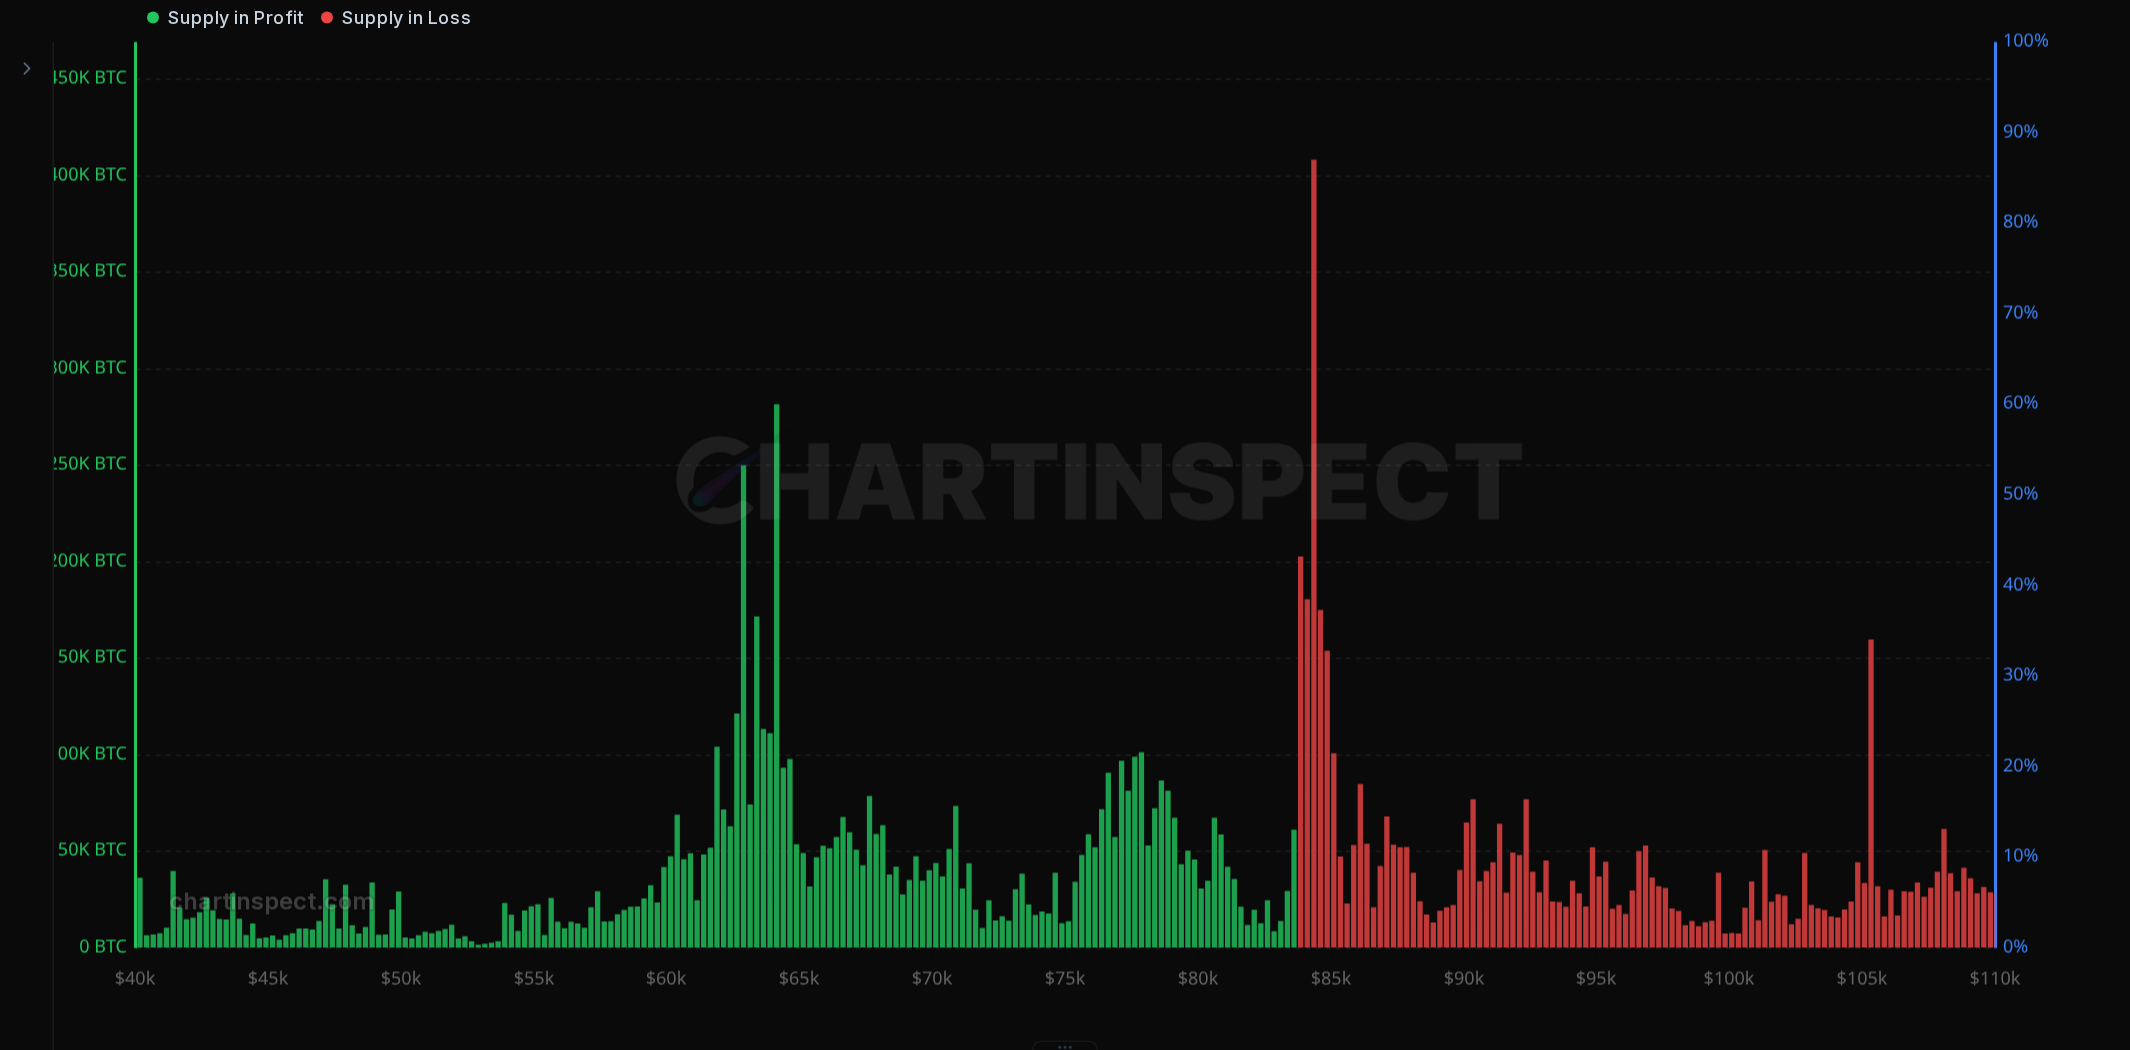
In the video, I pointed to $87K–$95K as a region where some holders might be relieved to get their money back. If you've sat through months of losses, the chance to exit near break-even can be tempting.
URPD records where coins last moved on-chain, and transfers aren't always purchases. It can't tell us who will sell, but these cost bases are an area where I'd watch for resistance.
I'd be comfortable with Bitcoin taking time to work through that area if buyers continued to defend the support levels below it. I'd be less comfortable if each rally faded and those levels started giving way.
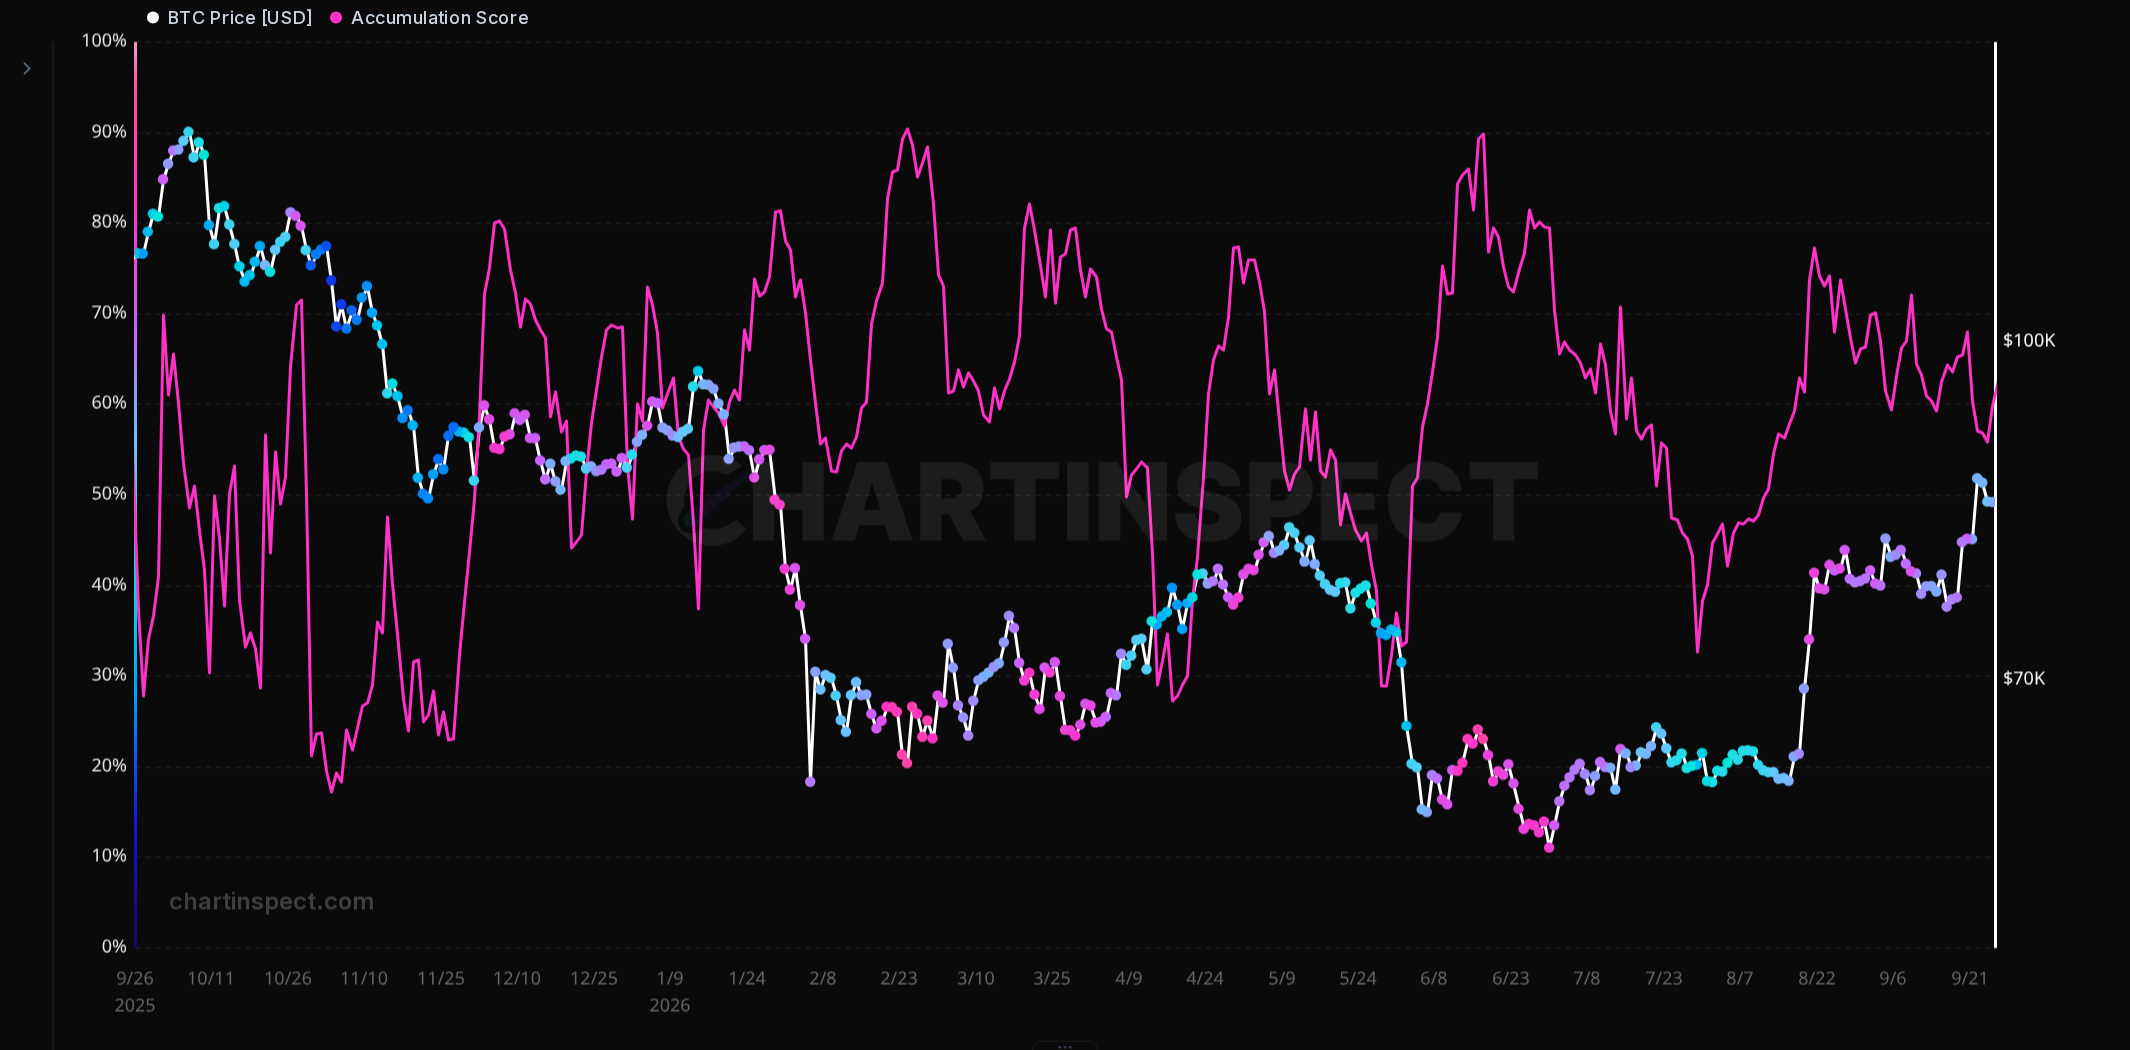
I'd like to see accumulation strengthen alongside price. If the Accumulation Index weakens while price struggles overhead, I'd be more cautious about expecting a quick continuation higher.
What would change my mind
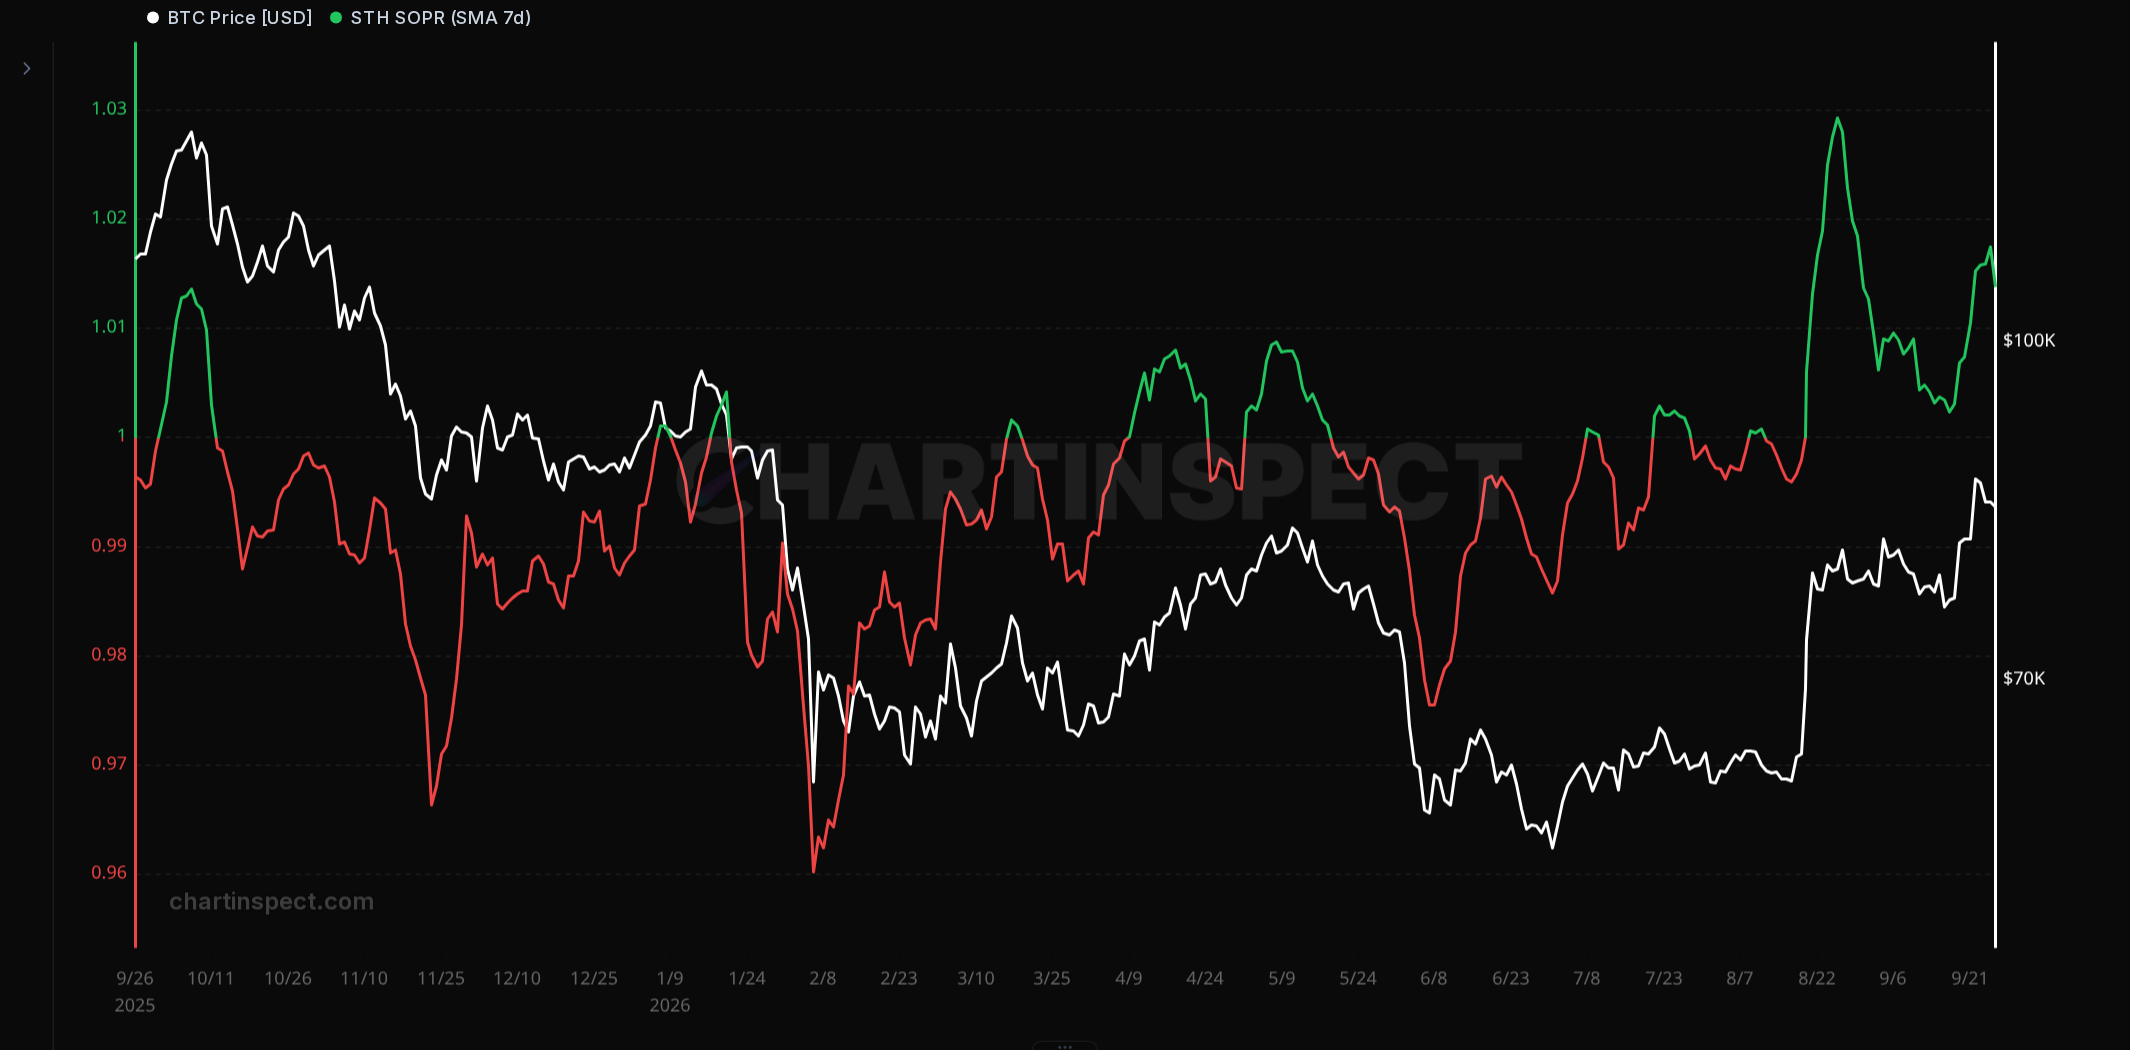
This is the last chart I check when judging a pullback. The earlier SOPR chart covers the wider market; STH SOPR focuses on coins held for less than 155 days. If Bitcoin comes back toward recent buyers' cost basis, I want to see their loss-taking ease and this measure recover above 1.
I don't want to judge the recovery by a count of days above one line. March's newsletter put weight on a sustained hold above True Market Mean. A hold also needs to survive a pullback, with the other measures supporting it.
Three developments would make me reconsider the bullish case:
- Failed support: Bitcoin loses True Market Mean and repeatedly fails to reclaim it, followed by sustained weakness below short-term holder cost basis.
- Renewed holder stress: active supply stays mostly in loss for a couple of weeks, while recent buyers remain below break-even.
- Persistent loss-taking: seven-day SOPR stays below 1, with STH SOPR showing that recent buyers are also continuing to take losses.
I don't need all three to happen before becoming more cautious. Seeing them together would make it much harder to argue that this was an ordinary pullback.
For now, June remains my base case for the low. I can allow for a messy recovery without expecting every dip to turn into another bear-market leg. The next thing I want to see is buyers defending the levels they've recovered.
Follow the charts at ChartInspect and read the earlier analysis at ChartInspect Research.
Enjoyed this article?
Subscribe to get the latest research in your inbox.
Comments
Sign in to join the discussion.